Causal diagrams for physical models

Source: ArXiv

AI Quick Summary

Summary: This paper introduces a method for creating causal diagrams from physically motivated mathematical models, using temporal differential equations to enhance the understanding of processes and causal relationships within the systems. The approach aims to improve comprehension of complex physical models.

Share: Share on X LinkedIn

Summary

I present a scheme of drawing causal diagrams based on physically motivated mathematical models expressed in terms of temporal differential equations. They provide a means of better understanding the processes and causal relationships contained within such systems.

AI Key Findings

Generated Sep 07, 2025

Methodology

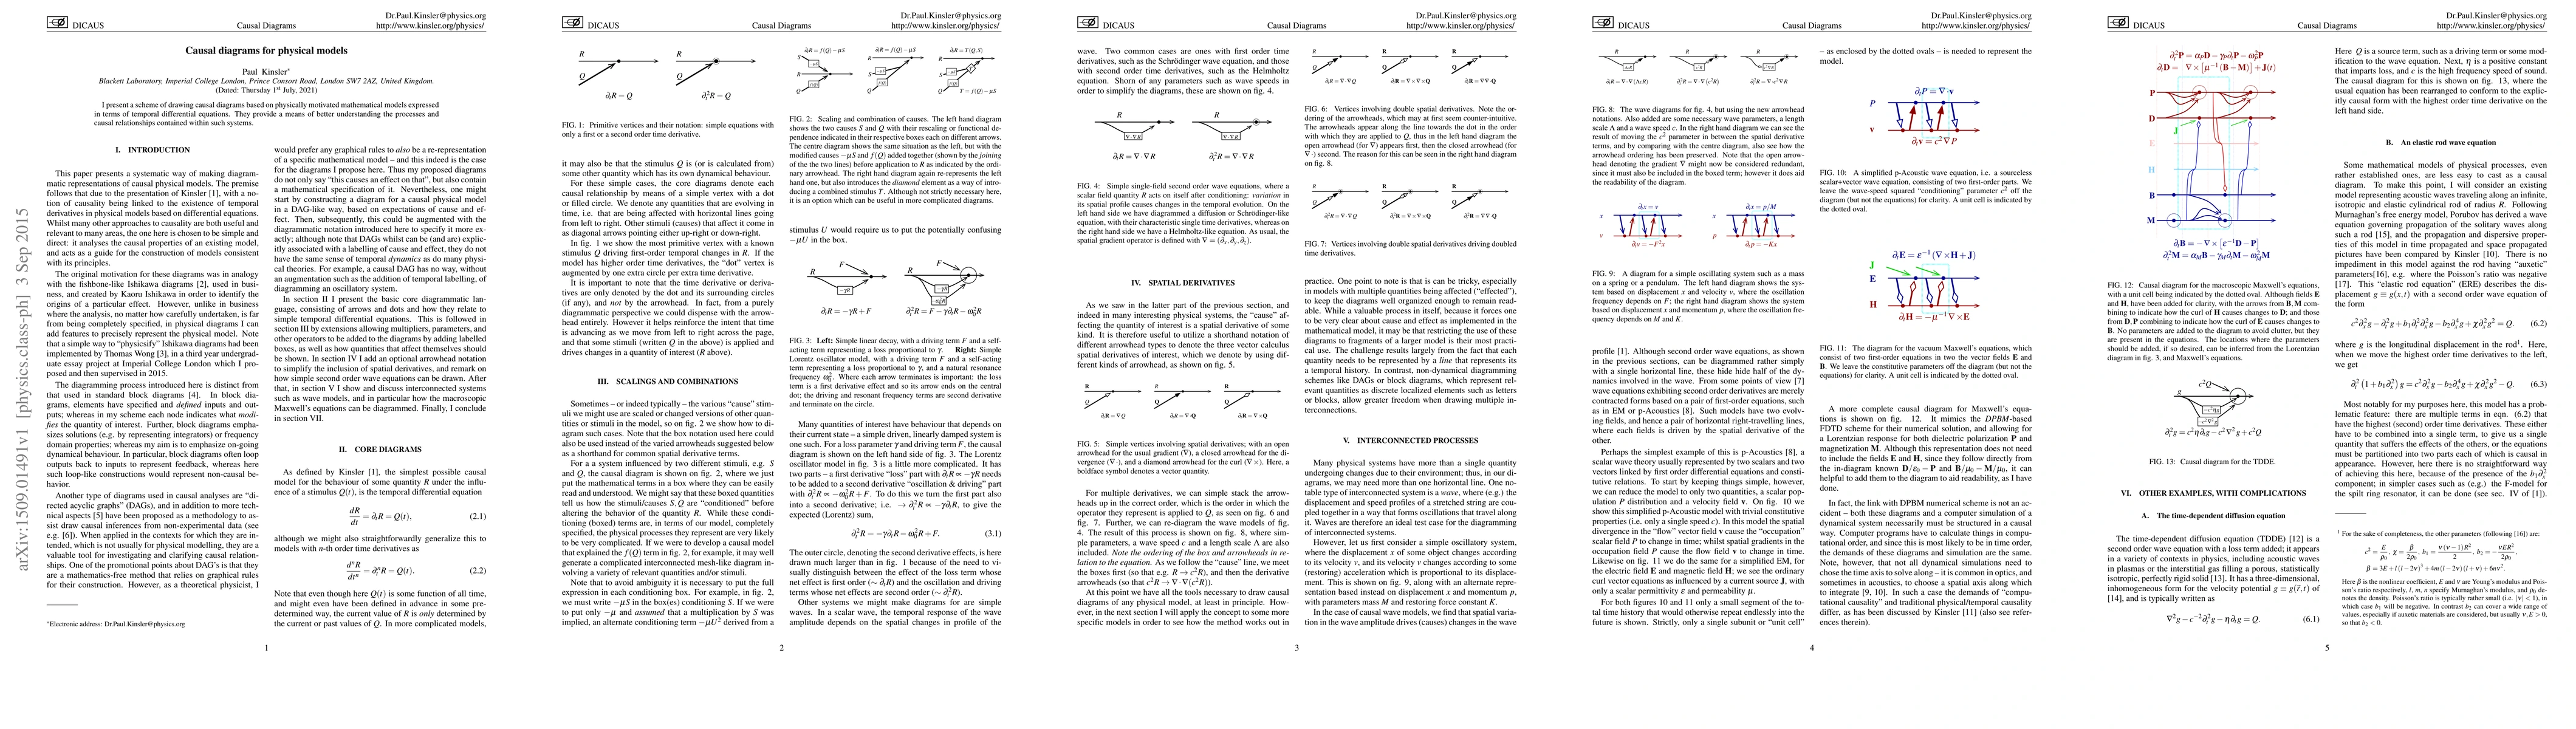
The paper presents a scheme for drawing causal diagrams based on physically motivated mathematical models expressed as temporal differential equations, aiming to enhance understanding of processes and causal relationships within such systems.

Key Results

  • Causal diagrams are constructed using primitive vertices denoted by dots or filled circles, representing first or second-order time derivatives.
  • Scaling and combination of causes are illustrated using box notation for conditioning terms, which can represent complex physical processes.
  • Interconnected processes, such as wave and oscillatory systems, are diagrammed with multiple horizontal lines representing different quantities undergoing changes due to their environment.
  • Spatial derivatives are denoted using different arrowhead types, with boldface symbols indicating vector quantities.
  • The method is applied to specific models, including a simple linear decay, Lorentz oscillator, and wave models, demonstrating the diagramming of physical models.

Significance

This research provides a valuable tool for visualizing causal relationships in physical models, which can aid in understanding complex systems and potentially lead to more intuitive numerical simulations.

Technical Contribution

The paper introduces a novel approach for creating causal diagrams from physically motivated mathematical models, using temporal differential equations and specific notations for various derivatives.

Novelty

This work presents a unique method for diagramming physical models, focusing on causality and providing a visual representation of complex processes that can potentially simplify the development of numerical simulations.

Limitations

  • The diagrams may become cluttered and difficult to read when dealing with multiple quantities being affected simultaneously.
  • The method primarily focuses on time-dependent processes and may not be directly applicable to non-dynamical diagramming schemes like DAGs or block diagrams.
  • Some mathematical models, like the elastico-rod wave equation, pose challenges in maintaining a rigorously causal interpretation.

Future Work

  • Exploring ways to maintain diagram readability for complex systems with numerous interconnected processes.
  • Investigating the applicability of causal diagrams to non-dynamical processes and comparing them with existing diagramming schemes.
  • Developing strategies to handle models with problematic causal interpretations, such as the elastico-rod wave equation.

Paper Details

PDF Preview

Download PDF

Key Terms

causal (0.440)
expressed terms (0.260)
contained (0.239)
physically (0.238)
diagrams (0.236)
relationships (0.230)
expressed (0.227)
differential equations (0.222)

Citation Network

Current paper (gray), citations (green), references (blue)

Display is limited for performance on very large graphs.

Current Paper
Citations
References
Click to view

Similar Papers

Found 4 papers
Title Authors Year Actions

Comments (0)

This website uses cookies to ensure you get the best experience. Learn more