Causal Support: Modeling Causal Inferences with Visualizations
Publication
Metrics
AI Quick Summary
This paper evaluates the quality of causal inferences made from visualizations using a Bayesian cognition model called causal support. Experiments reveal that visual analytics users often make unreliable causal inferences, especially regarding treatment effects and confounding relationships, despite the potential benefits of interactive data filtering.
Paper Preview
Abstract
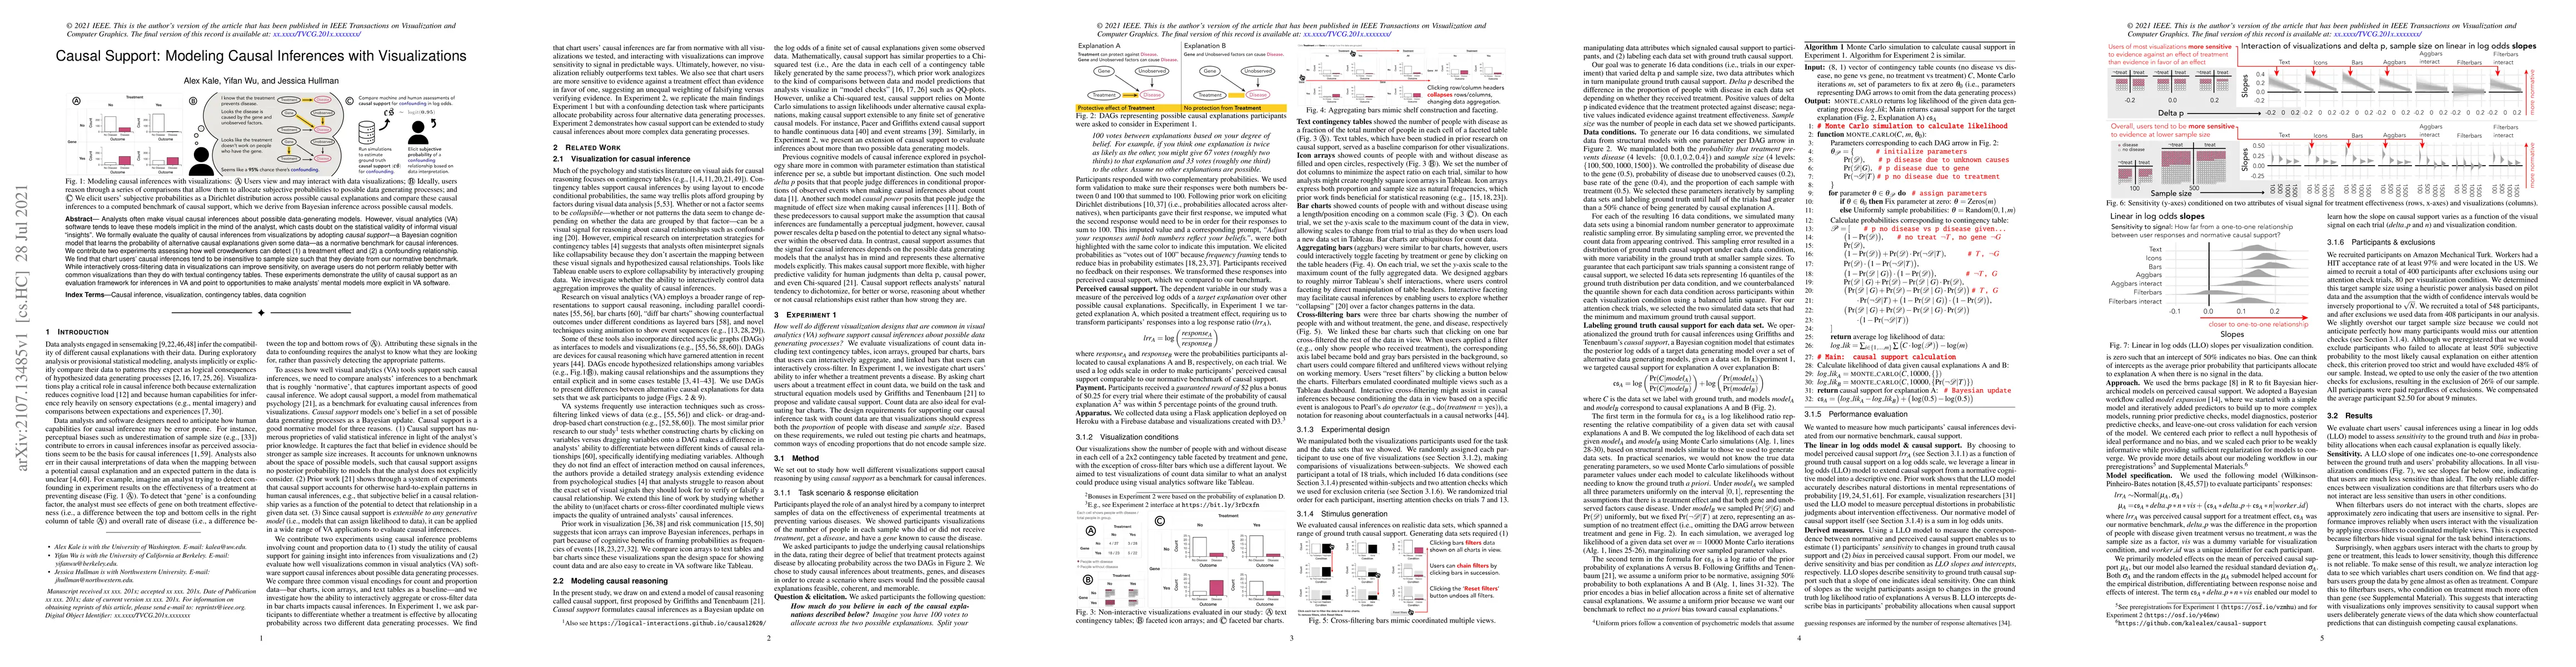
Analysts often make visual causal inferences about possible data-generating models. However, visual analytics (VA) software tends to leave these models implicit in the mind of the analyst, which casts doubt on the statistical validity of informal visual "insights". We formally evaluate the quality of causal inferences from visualizations by adopting causal support -- a Bayesian cognition model that learns the probability of alternative causal explanations given some data -- as a normative benchmark for causal inferences. We contribute two experiments assessing how well crowdworkers can detect (1) a treatment effect and (2) a confounding relationship. We find that chart users' causal inferences tend to be insensitive to sample size such that they deviate from our normative benchmark. While interactively cross-filtering data in visualizations can improve sensitivity, on average users do not perform reliably better with common visualizations than they do with textual contingency tables. These experiments demonstrate the utility of causal support as an evaluation framework for inferences in VA and point to opportunities to make analysts' mental models more explicit in VA software.
AI Key Findings
Get AI-generated insights about this paper's methodology, results, significance, and more — seven facets brought into focus.
Impact
Paper Details
Authors
PDF Preview
Key Terms
Citation Network
Current paper (gray), citations (green), references (blue)
Display is limited for performance on very large graphs.
Discussion 0