Causalvis is a Python visualization package designed to support the entire causal inference process, addressing the lack of existing tools. It features four interactive modules developed through an iterative design process with causal inference experts, effectively aiding in the iterative analysis and collaboration necessary for causal inference.
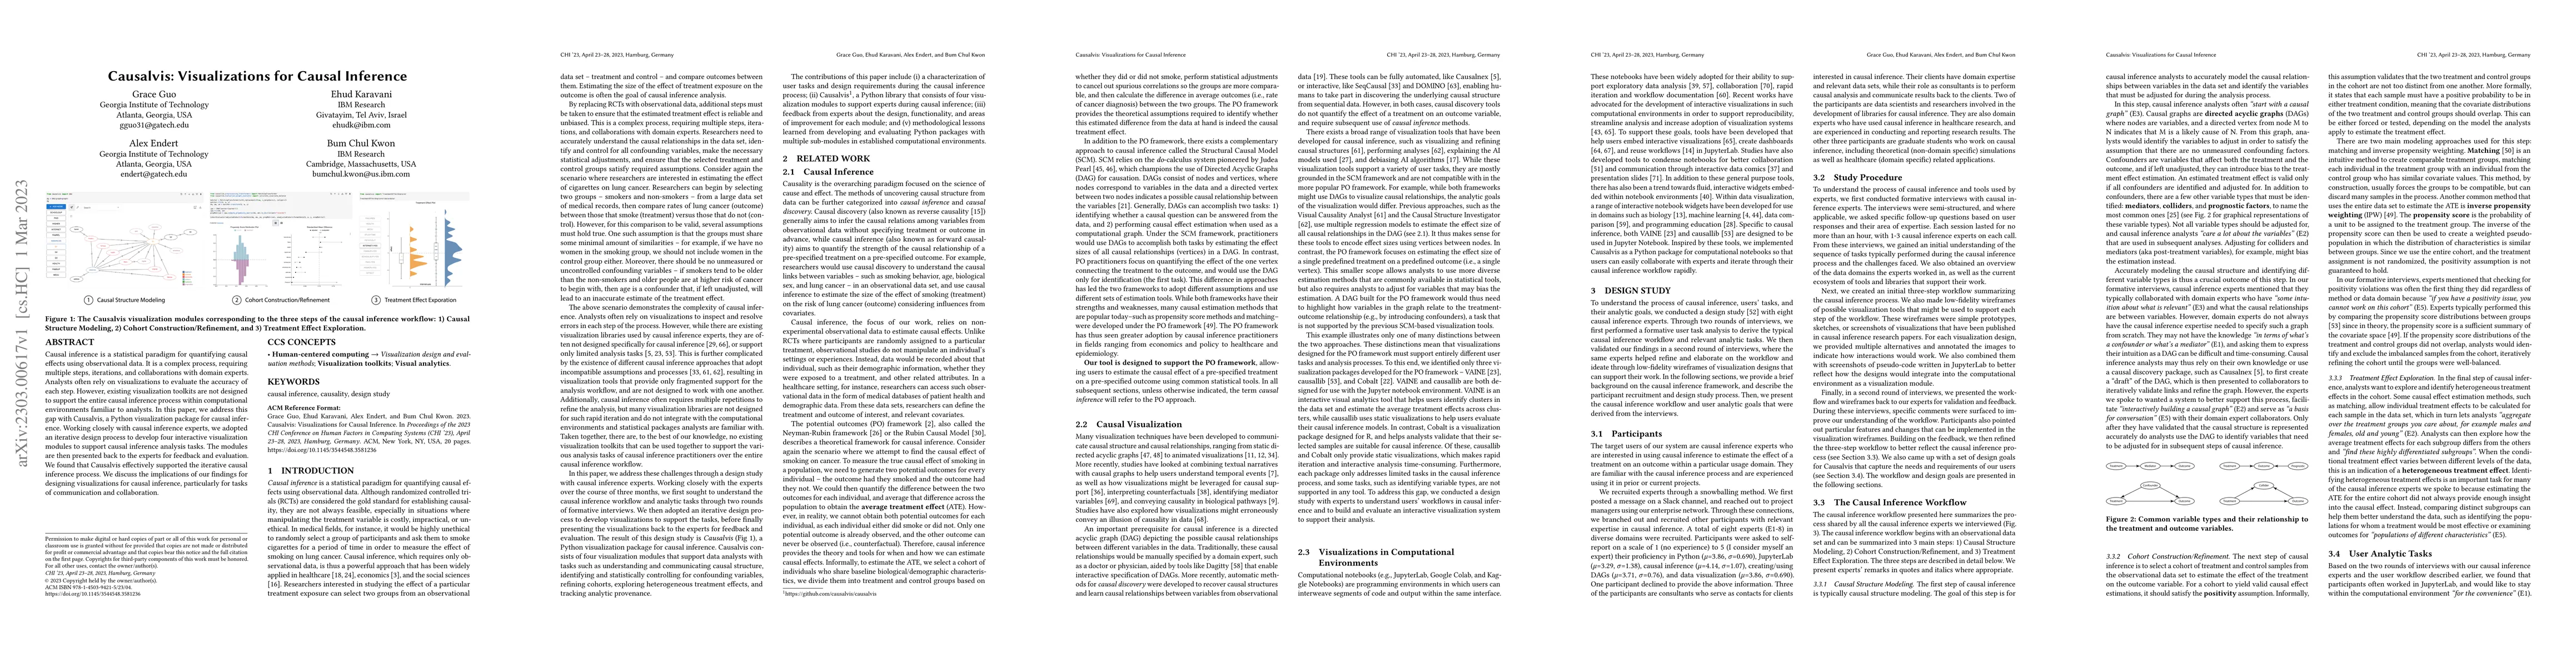
Causal inference is a statistical paradigm for quantifying causal effects using observational data. It is a complex process, requiring multiple steps, iterations, and collaborations with domain experts. Analysts often rely on visualizations to evaluate the accuracy of each step. However, existing visualization toolkits are not designed to support the entire causal inference process within computational environments familiar to analysts. In this paper, we address this gap with Causalvis, a Python visualization package for causal inference. Working closely with causal inference experts, we adopted an iterative design process to develop four interactive visualization modules to support causal inference analysis tasks. The modules are then presented back to the experts for feedback and evaluation. We found that Causalvis effectively supported the iterative causal inference process. We discuss the implications of our findings for designing visualizations for causal inference, particularly for tasks of communication and collaboration.
Get AI-generated insights about this paper's methodology, results, and significance.
Current paper (gray), citations (green), references (blue)
Arran Zeyu Wang, David Borland, David Gotz
Title | Authors | Year | Actions |
---|---|---|---|
How large must an associational mean difference be to support a causal effect?
|
Michael Höfler, Ekaterina Pronizius, E. Buchanan
|
2024
|
View Paper |
Causal Priors and Their Influence on Judgements of Causality in Visualized Data
|
Arran Zeyu Wang, D. Borland, Tabitha C. Peck, Wenyuan Wang, David Gotz
|
2024
|
View Paper |
A framework to improve causal inferences from visualizations using counterfactual operators
|
Arran Zeyu Wang, D. Borland, David Gotz
|
2024
|
View Paper |
Visual Analysis of Multi-Outcome Causal Graphs
|
Mengjie Fan, Jinlu Yu, Daniel Weiskopf, Nan Cao, Huai-Yu Wang, Liang Zhou
|
2024
|
View Paper |
CausalPrism: A Visual Analytics Approach for Subgroup-based Causal Heterogeneity Exploration
|
Jiehui Zhou, Xumeng Wang, Wong Kam-Kwai, Wei Zhang, Xingyu Liu, Juntian Zhang, Minfeng Zhu, Wei Chen
|
2024
|
View Paper |
Where do they go next? Causal inference-based prediction and visual analysis of graduates' first destination
|
Yi Chen, Wenqiang Wei, Li Wang, Yu Dong, Christy Jie Liang
|
2024
|
View Paper |
Visualization for Trust in Machine Learning Revisited: The State of the Field in 2023
|
Angelos Chatzimparmpas, Kostiantyn Kucher, A. Kerren
|
2024
|
View Paper |
An empirical study of counterfactual visualization to support visual causal inference
|
Arran Zeyu Wang, D. Borland, David Gotz
|
2024
|
View Paper |
Accelerating Causal Algorithms for Industrial-scale Data: A Distributed Computing Approach with Ray Framework
|
Vishal Verma, Vinod Reddy, Jaiprakash Ravi
|
2023
|
View Paper |
EVM: Incorporating Model Checking into Exploratory Visual Analysis
|
Alex Kale, Ziyang Guo, X. Qiao, Jeffrey Heer, J. Hullman
|
2023
|
View Paper |
V: Visual Aids for Identifying and Interpreting Spurious Associations in Data-Driven Decisions
|
Xian Teng, Yongsu Ahn, Y. Lin
|
2023
|
View Paper |
SuperNOVA: Design Strategies and Opportunities for Interactive Visualization in Computational Notebooks
|
Zijie J. Wang, David Munechika, Seongmin Lee, Duen Horng Chau
|
2023
|
View Paper |
Comments (0)