Academic Profile
Statistics
Similar Authors
Papers on arXiv
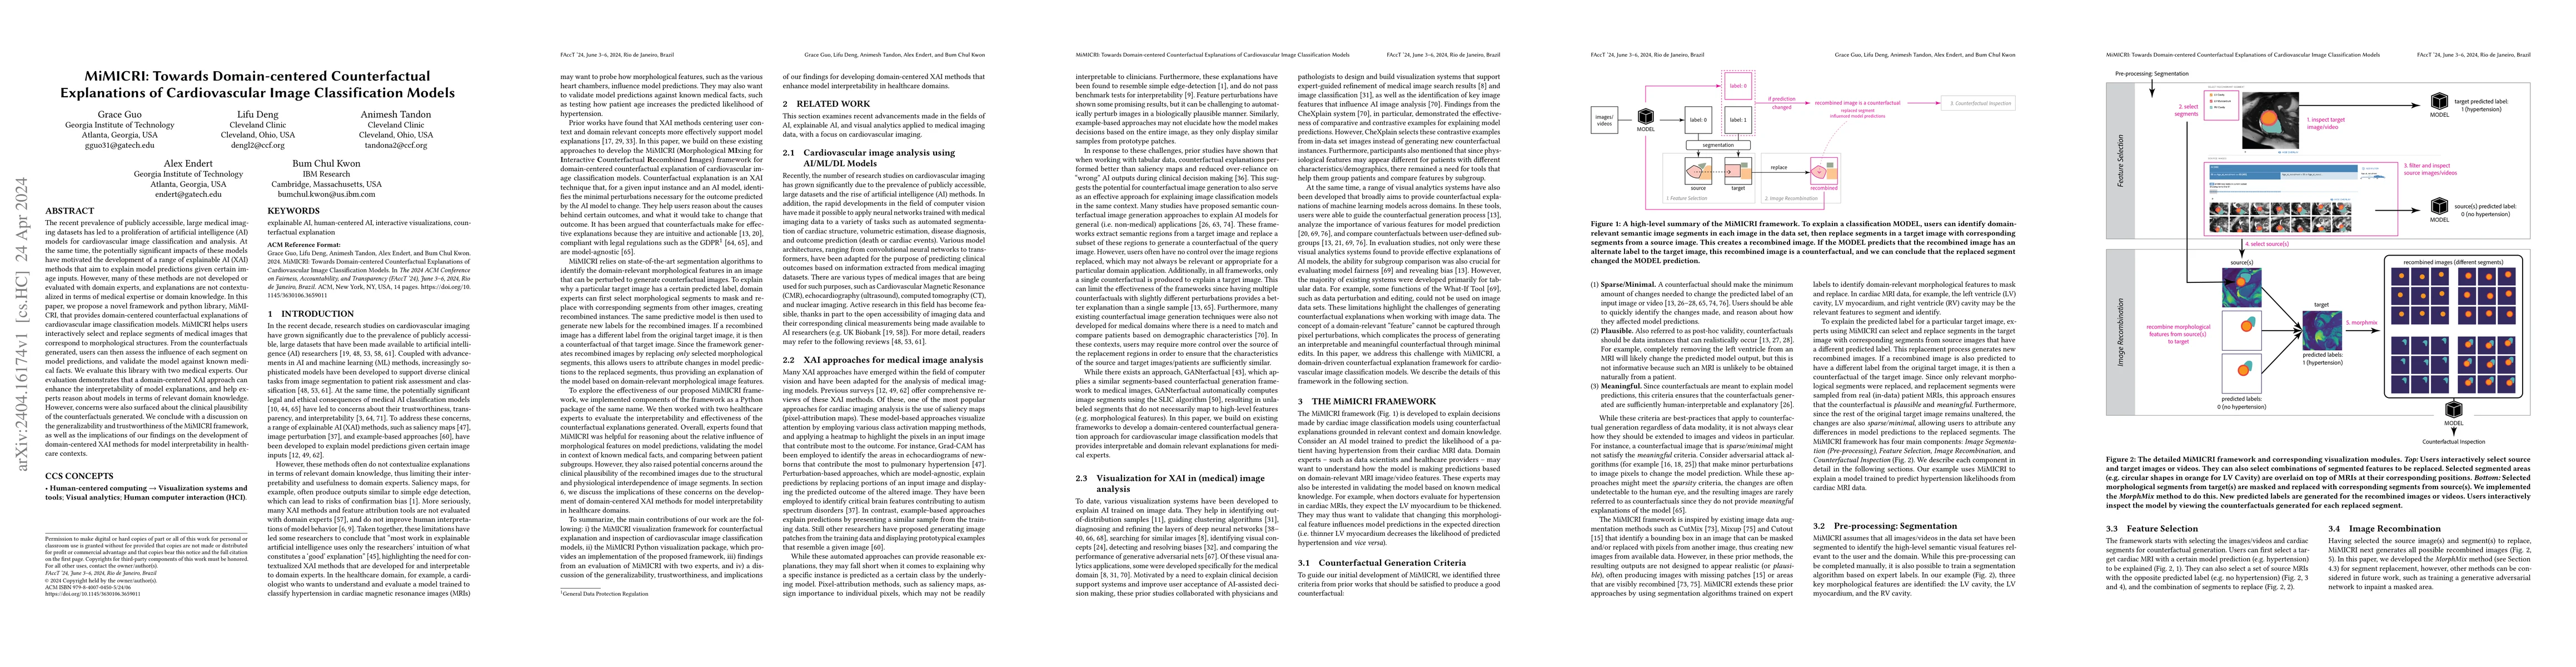
The recent prevalence of publicly accessible, large medical imaging datasets has led to a proliferation of artificial intelligence (AI) models for cardiovascular image classification and analysis. A...
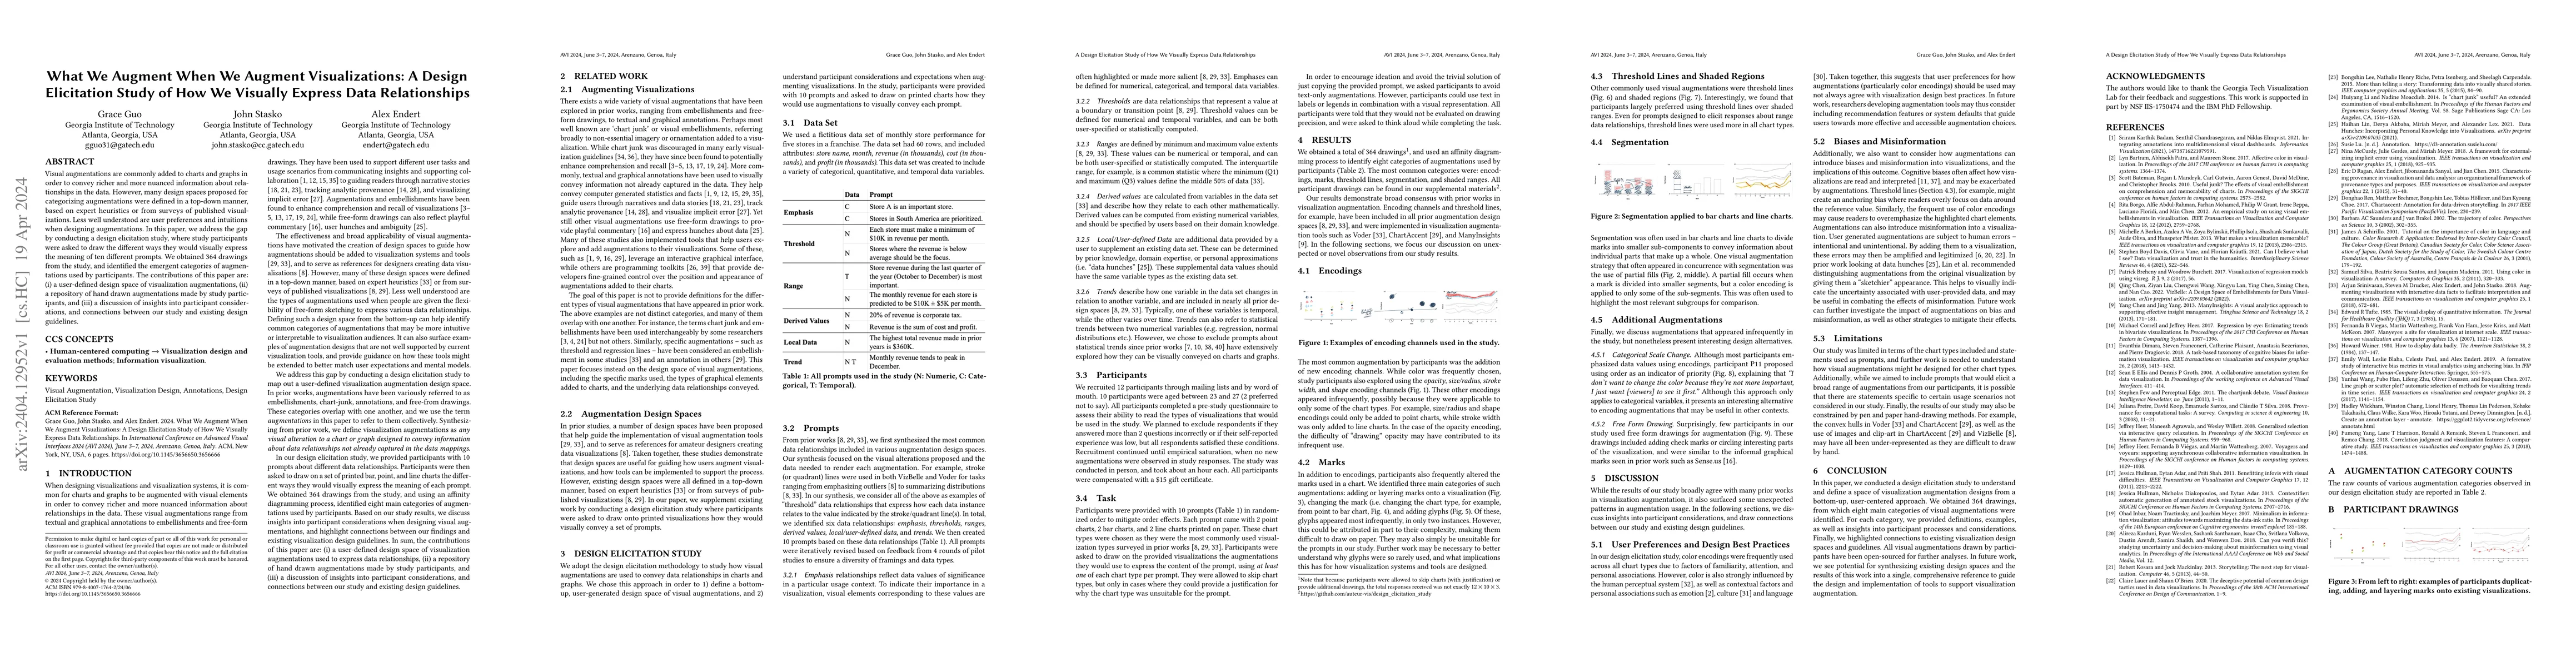
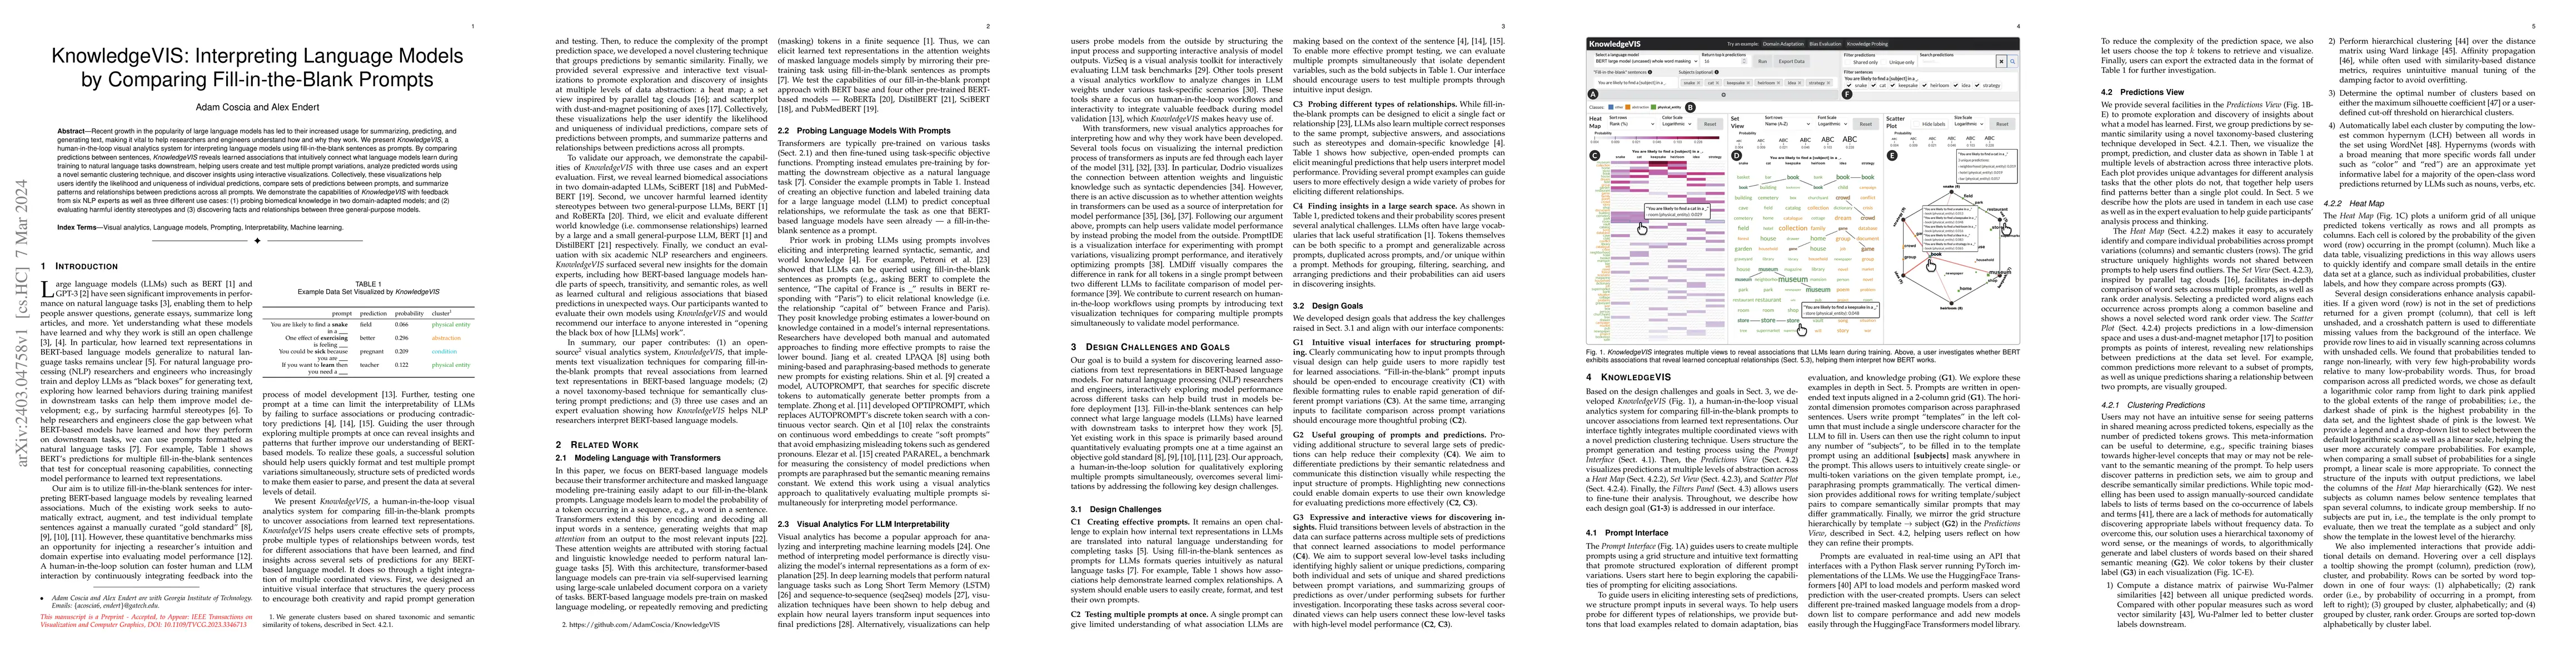
Visual augmentations are commonly added to charts and graphs in order to convey richer and more nuanced information about relationships in the data. However, many design spaces proposed for categori...
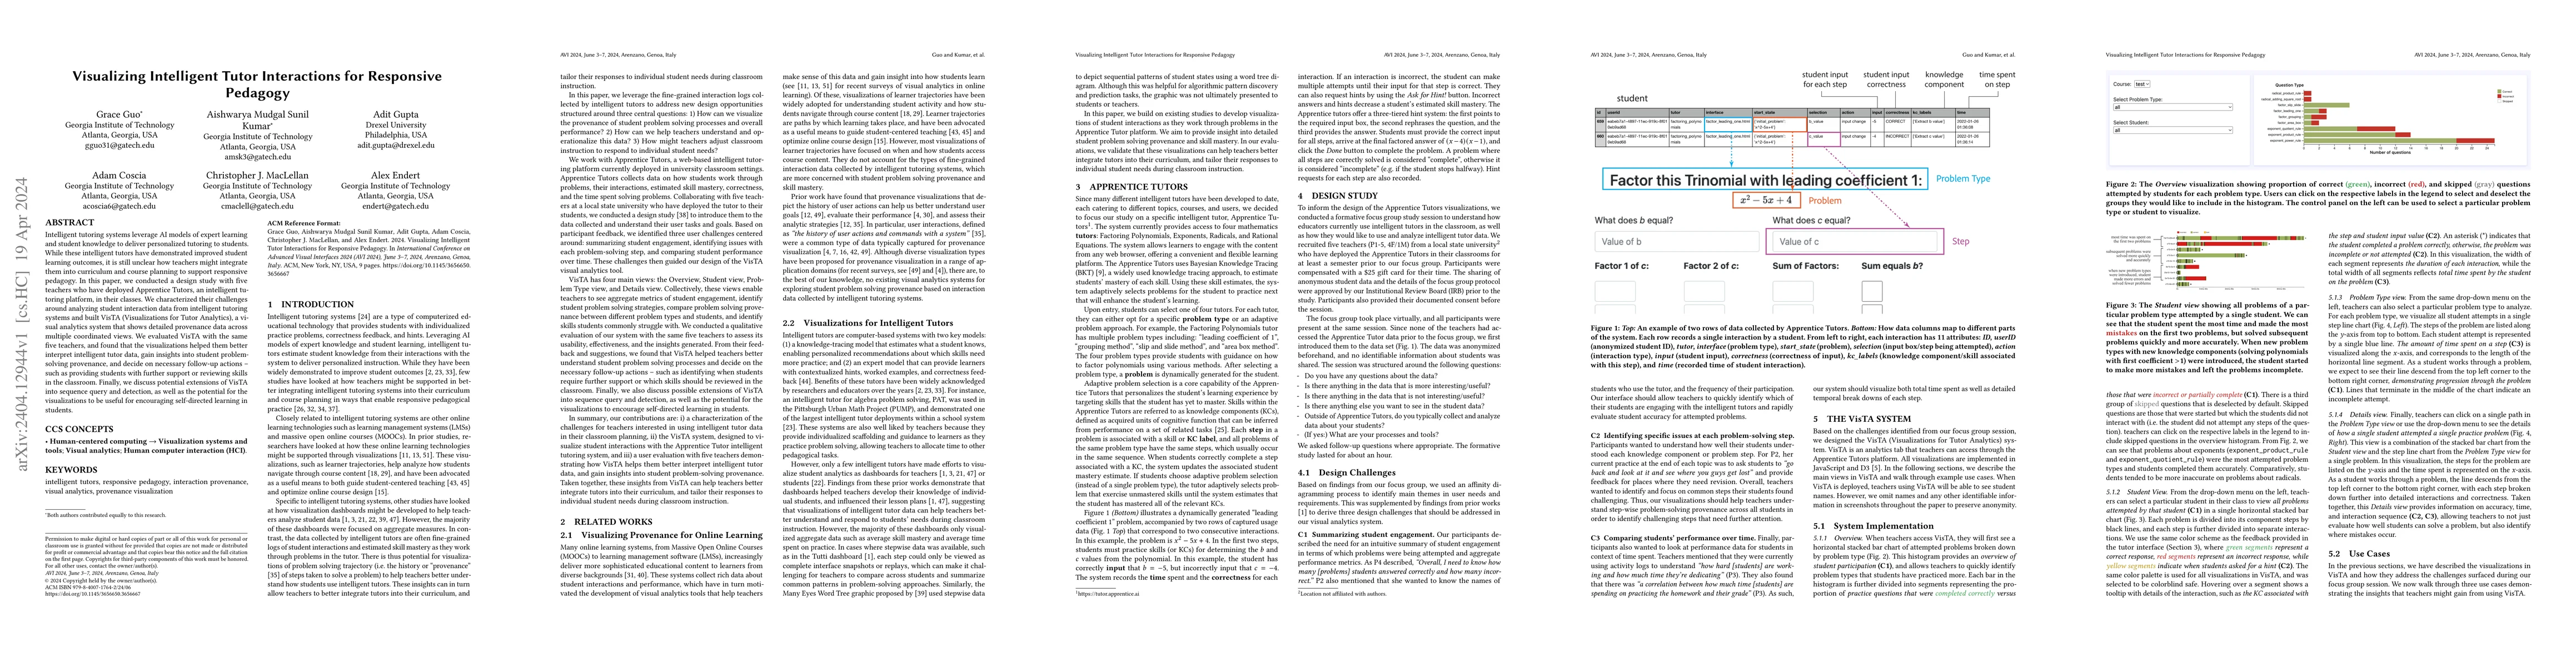
Intelligent tutoring systems leverage AI models of expert learning and student knowledge to deliver personalized tutoring to students. While these intelligent tutors have demonstrated improved stude...
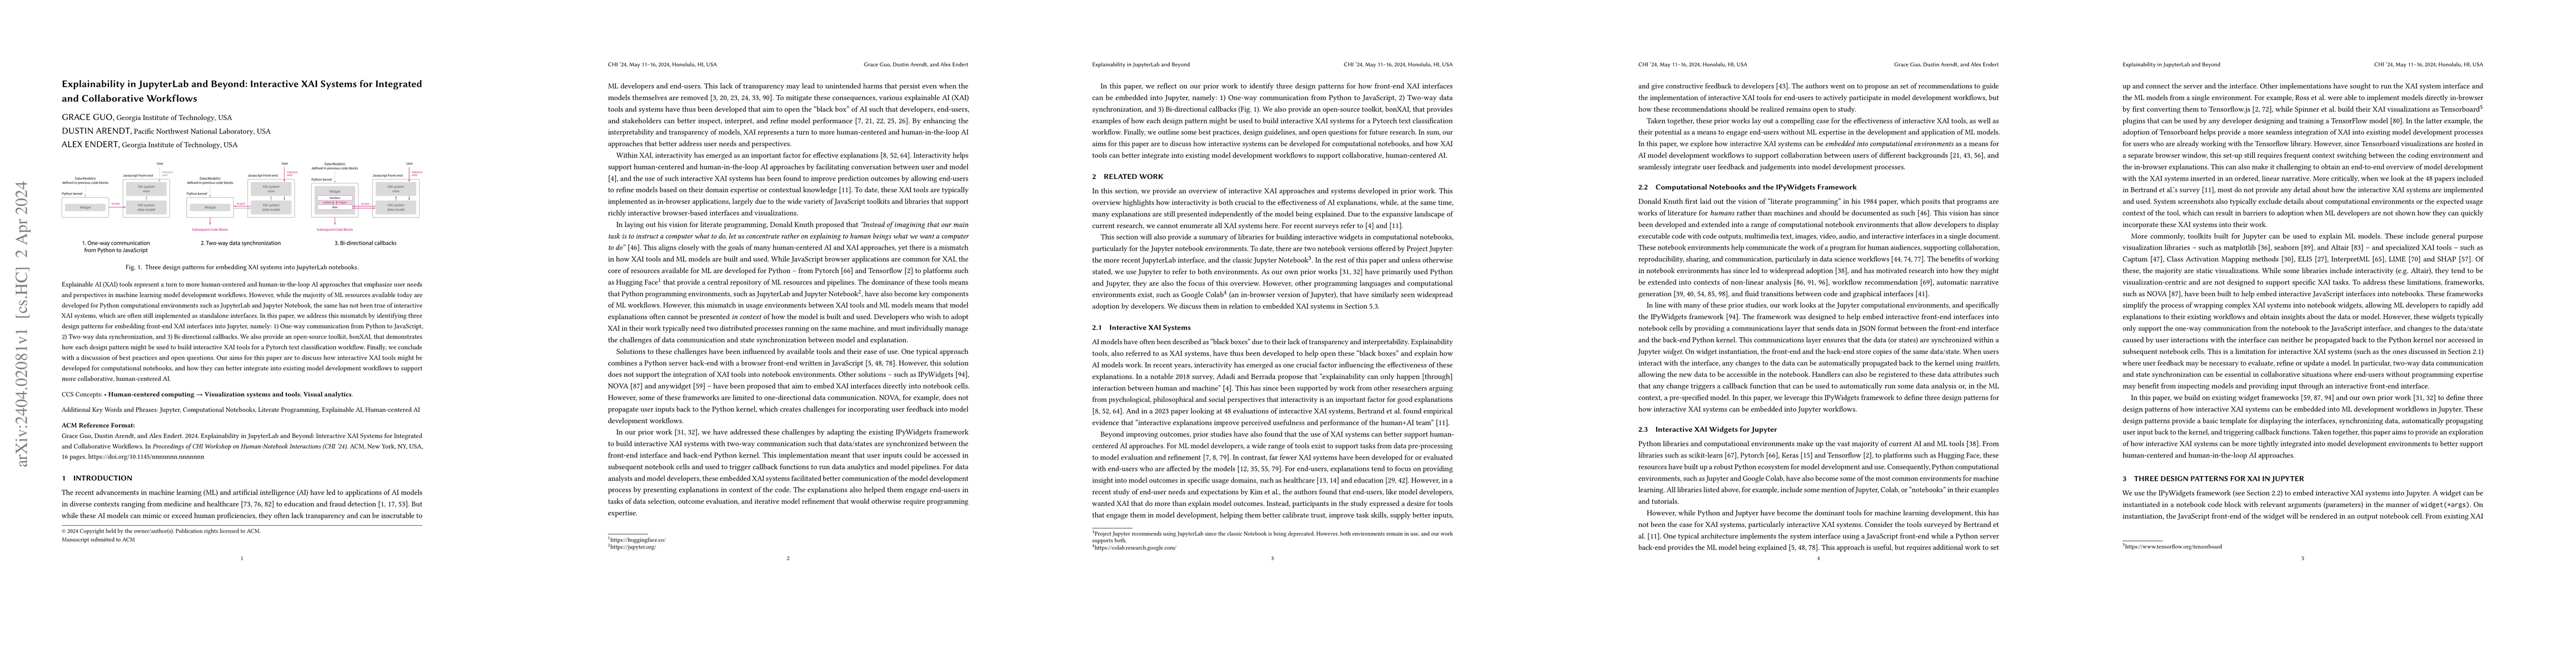
Explainable AI (XAI) tools represent a turn to more human-centered and human-in-the-loop AI approaches that emphasize user needs and perspectives in machine learning model development workflows. How...

Scientists studying deep ocean microbial ecosystems use limited numbers of sediment samples collected from the seafloor to characterize important life-sustaining biogeochemical cycles in the environ...
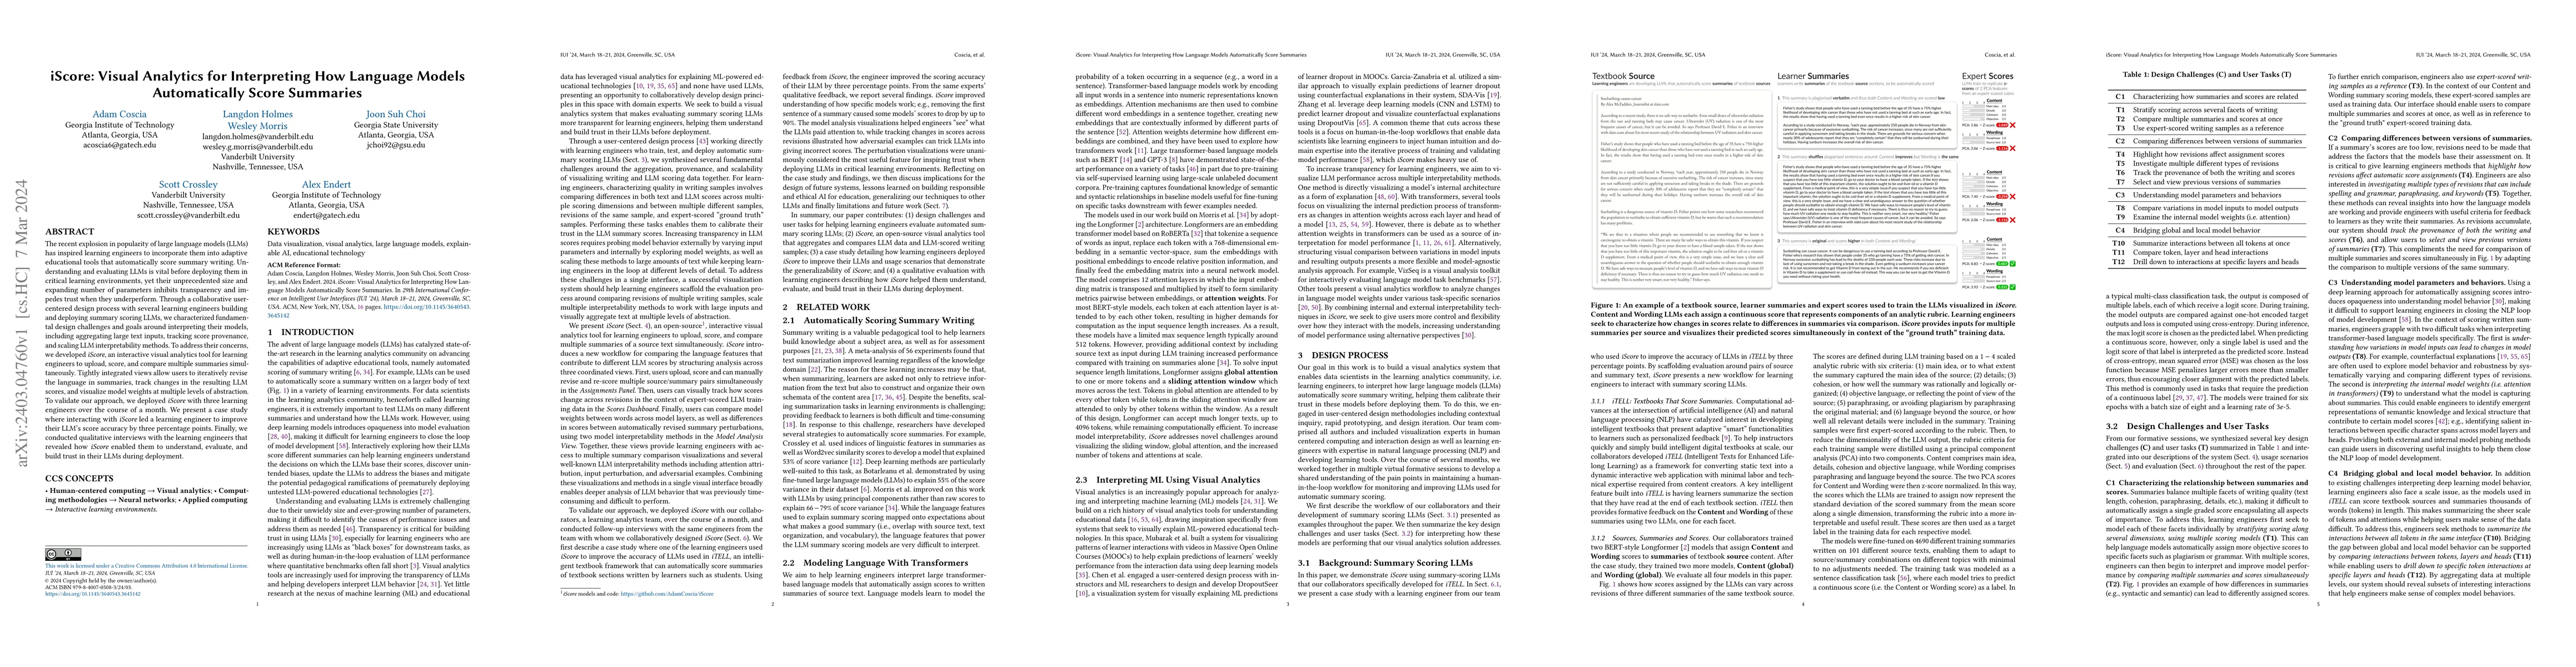
The recent explosion in popularity of large language models (LLMs) has inspired learning engineers to incorporate them into adaptive educational tools that automatically score summary writing. Under...
Recent growth in the popularity of large language models has led to their increased usage for summarizing, predicting, and generating text, making it vital to help researchers and engineers understa...
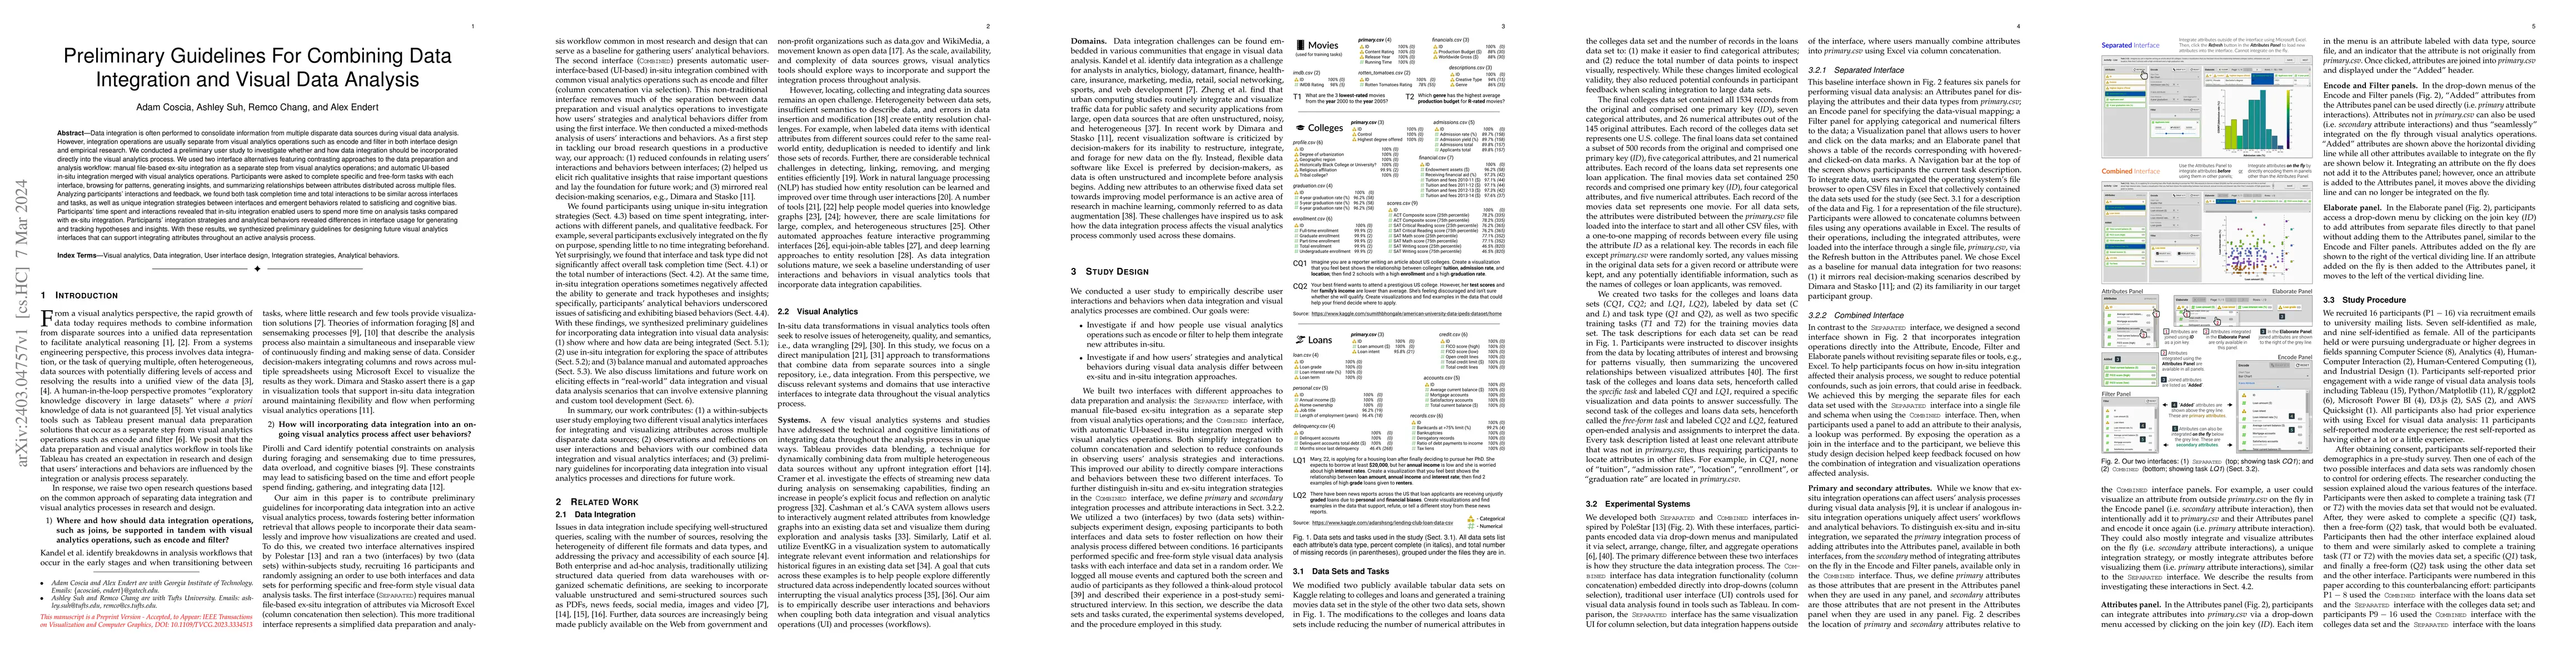
Data integration is often performed to consolidate information from multiple disparate data sources during visual data analysis. However, integration operations are usually separate from visual anal...
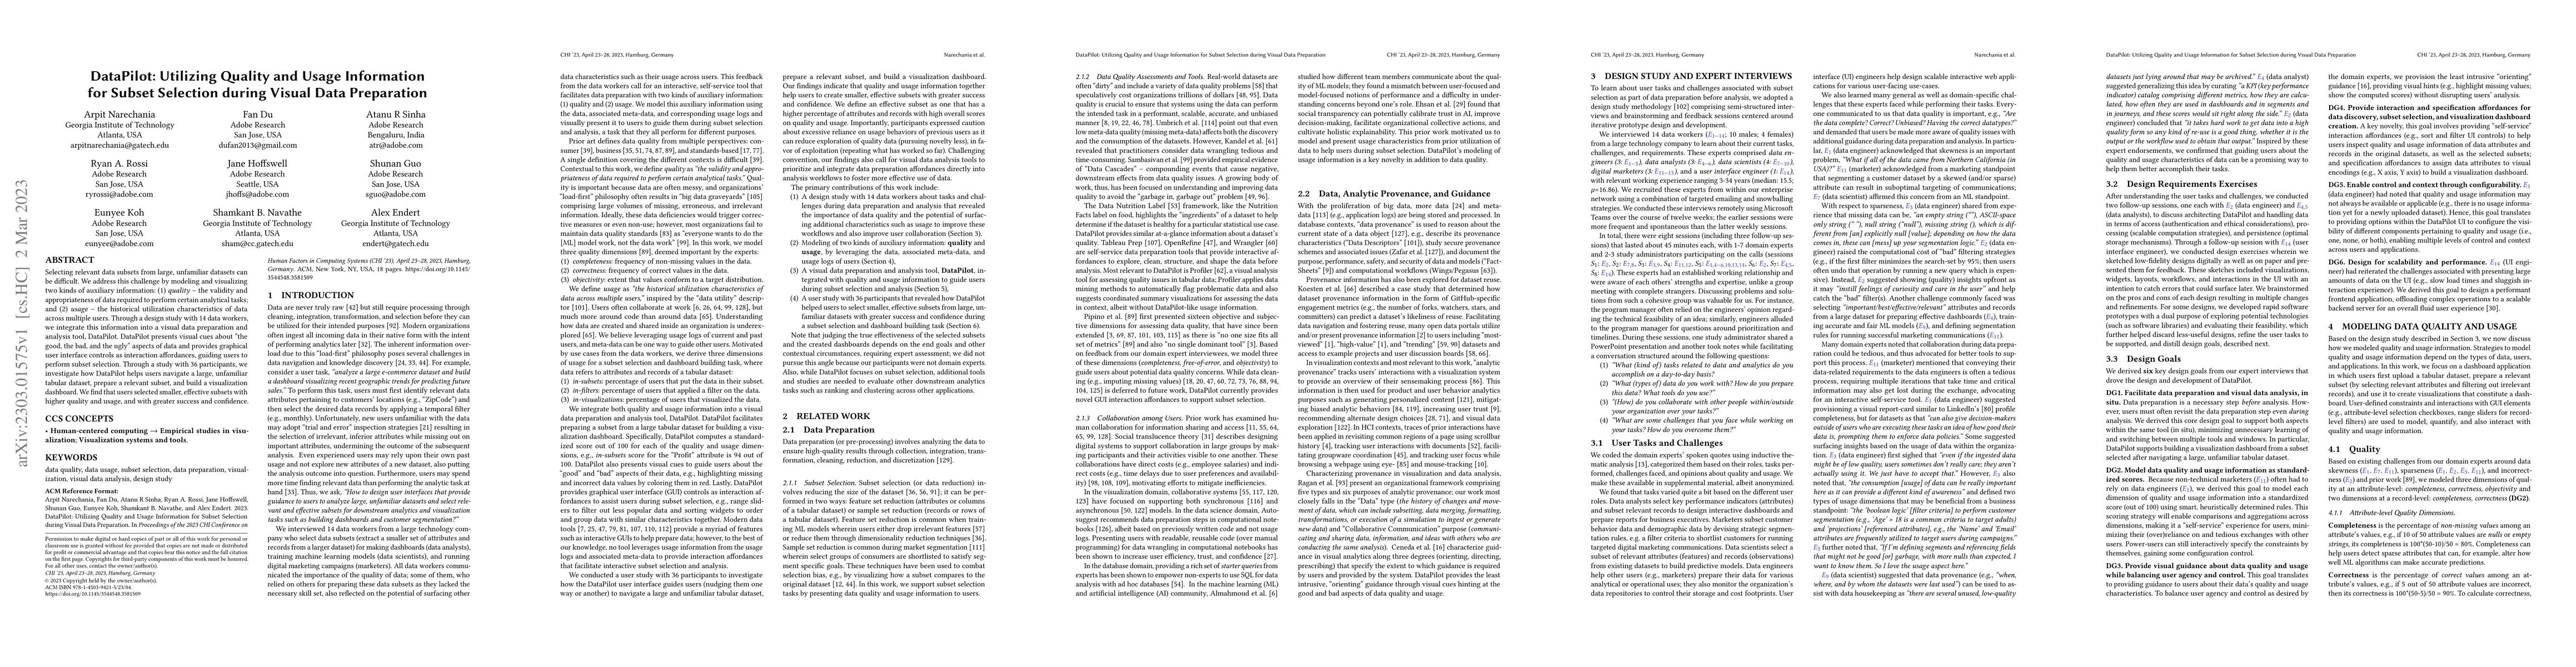
Selecting relevant data subsets from large, unfamiliar datasets can be difficult. We address this challenge by modeling and visualizing two kinds of auxiliary information: (1) quality - the validity...
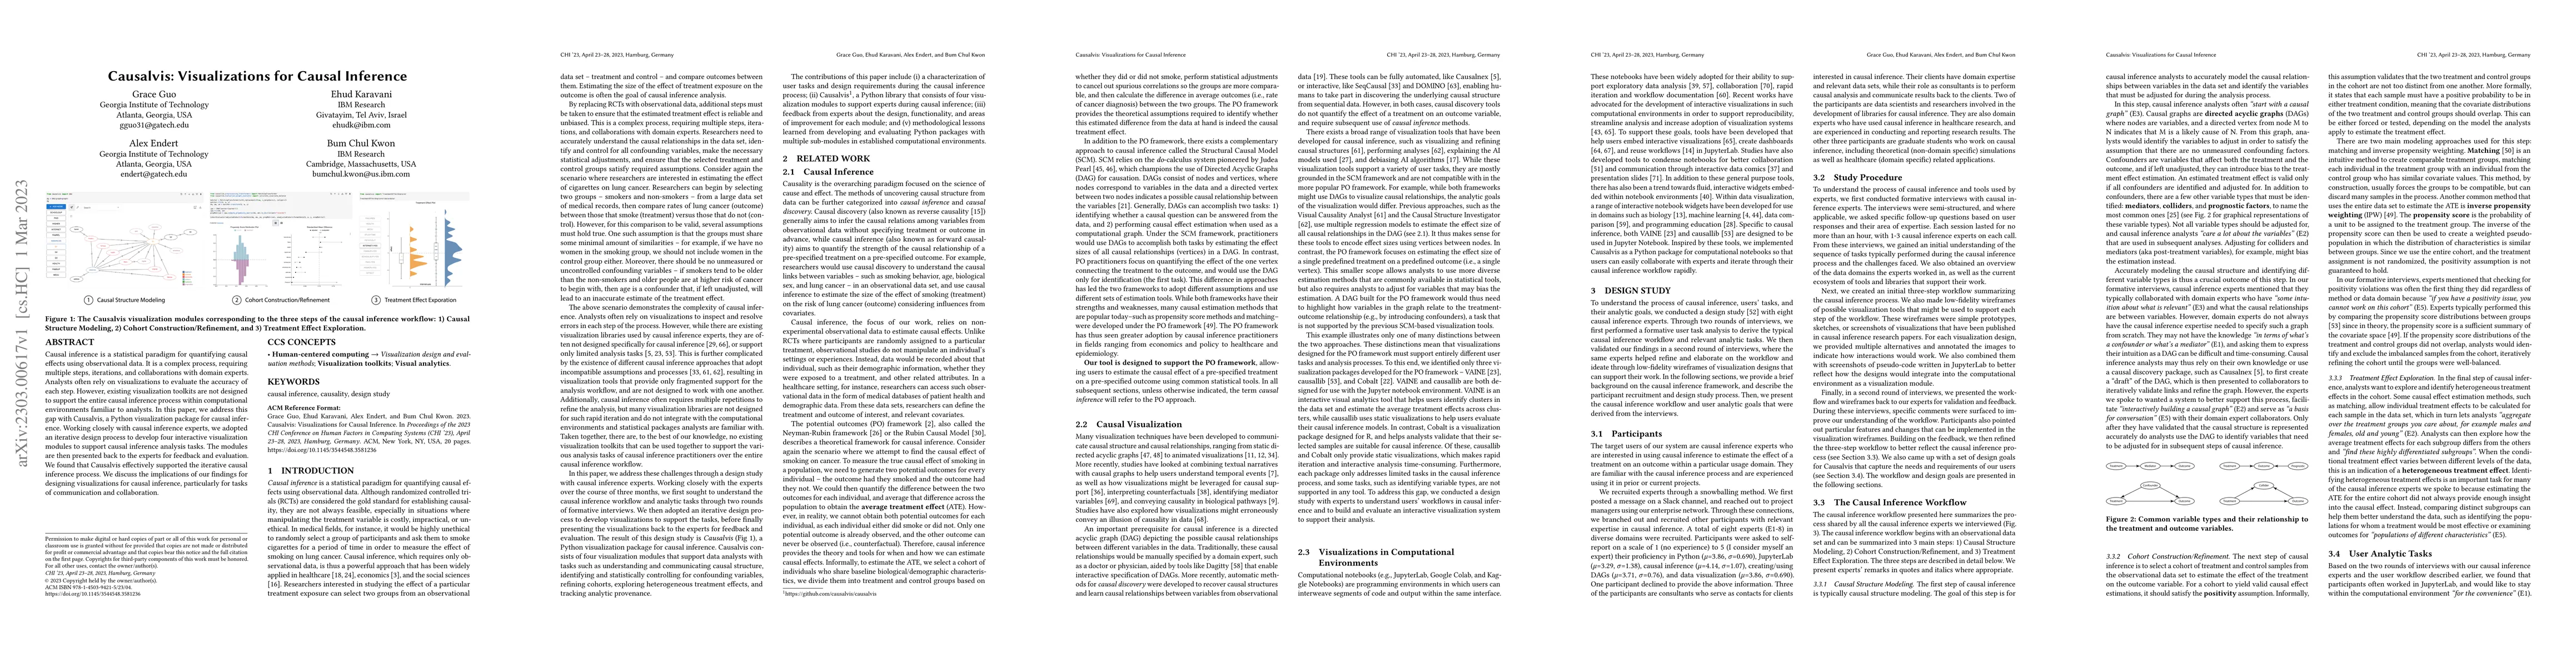
Causal inference is a statistical paradigm for quantifying causal effects using observational data. It is a complex process, requiring multiple steps, iterations, and collaborations with domain expe...
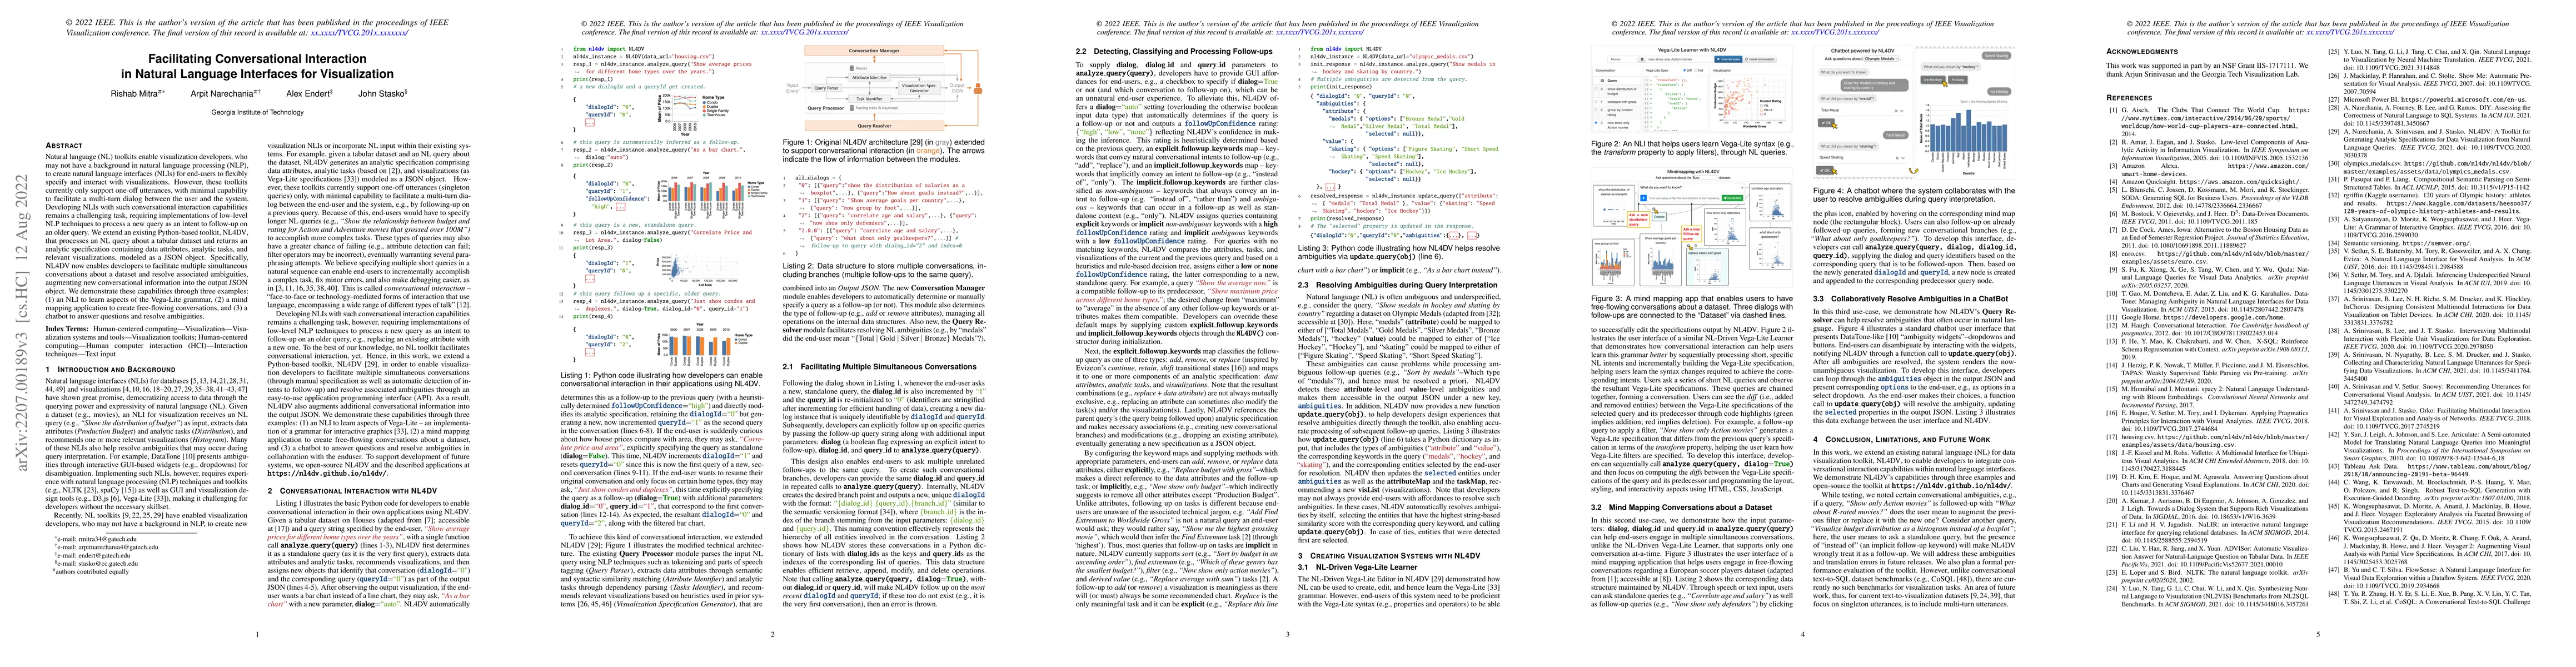
Natural language (NL) toolkits enable visualization developers, who may not have a background in natural language processing (NLP), to create natural language interfaces (NLIs) for end-users to flex...
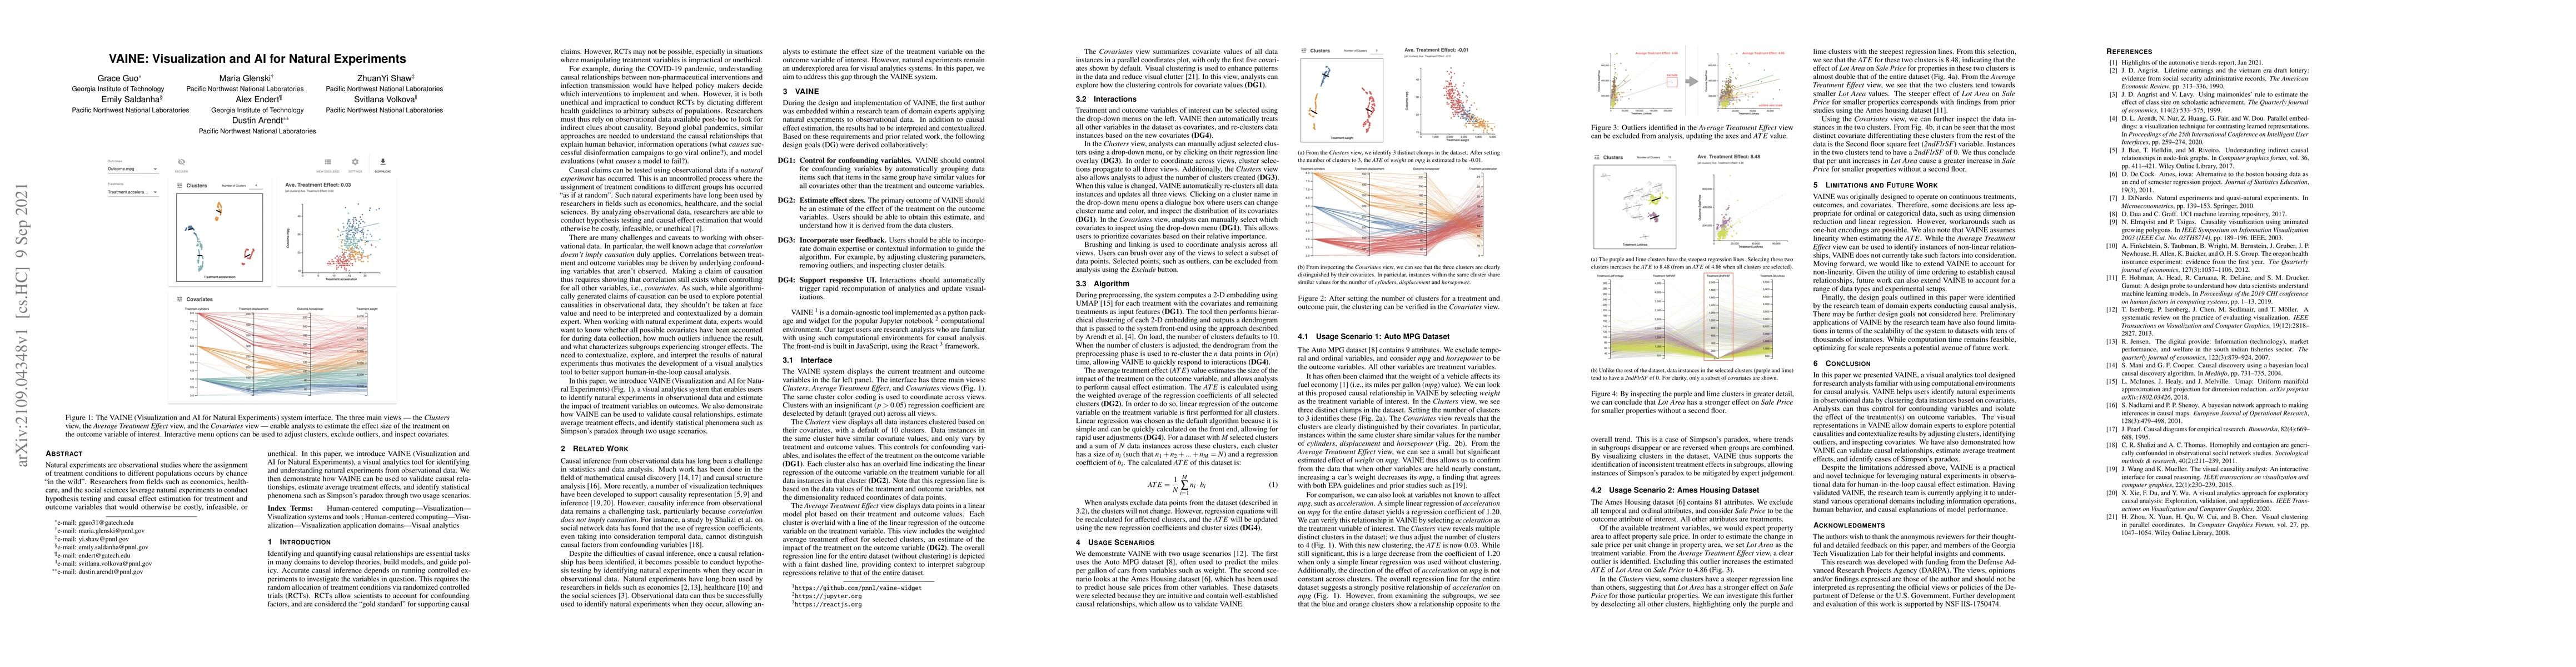
Natural experiments are observational studies where the assignment of treatment conditions to different populations occurs by chance "in the wild". Researchers from fields such as economics, healthc...
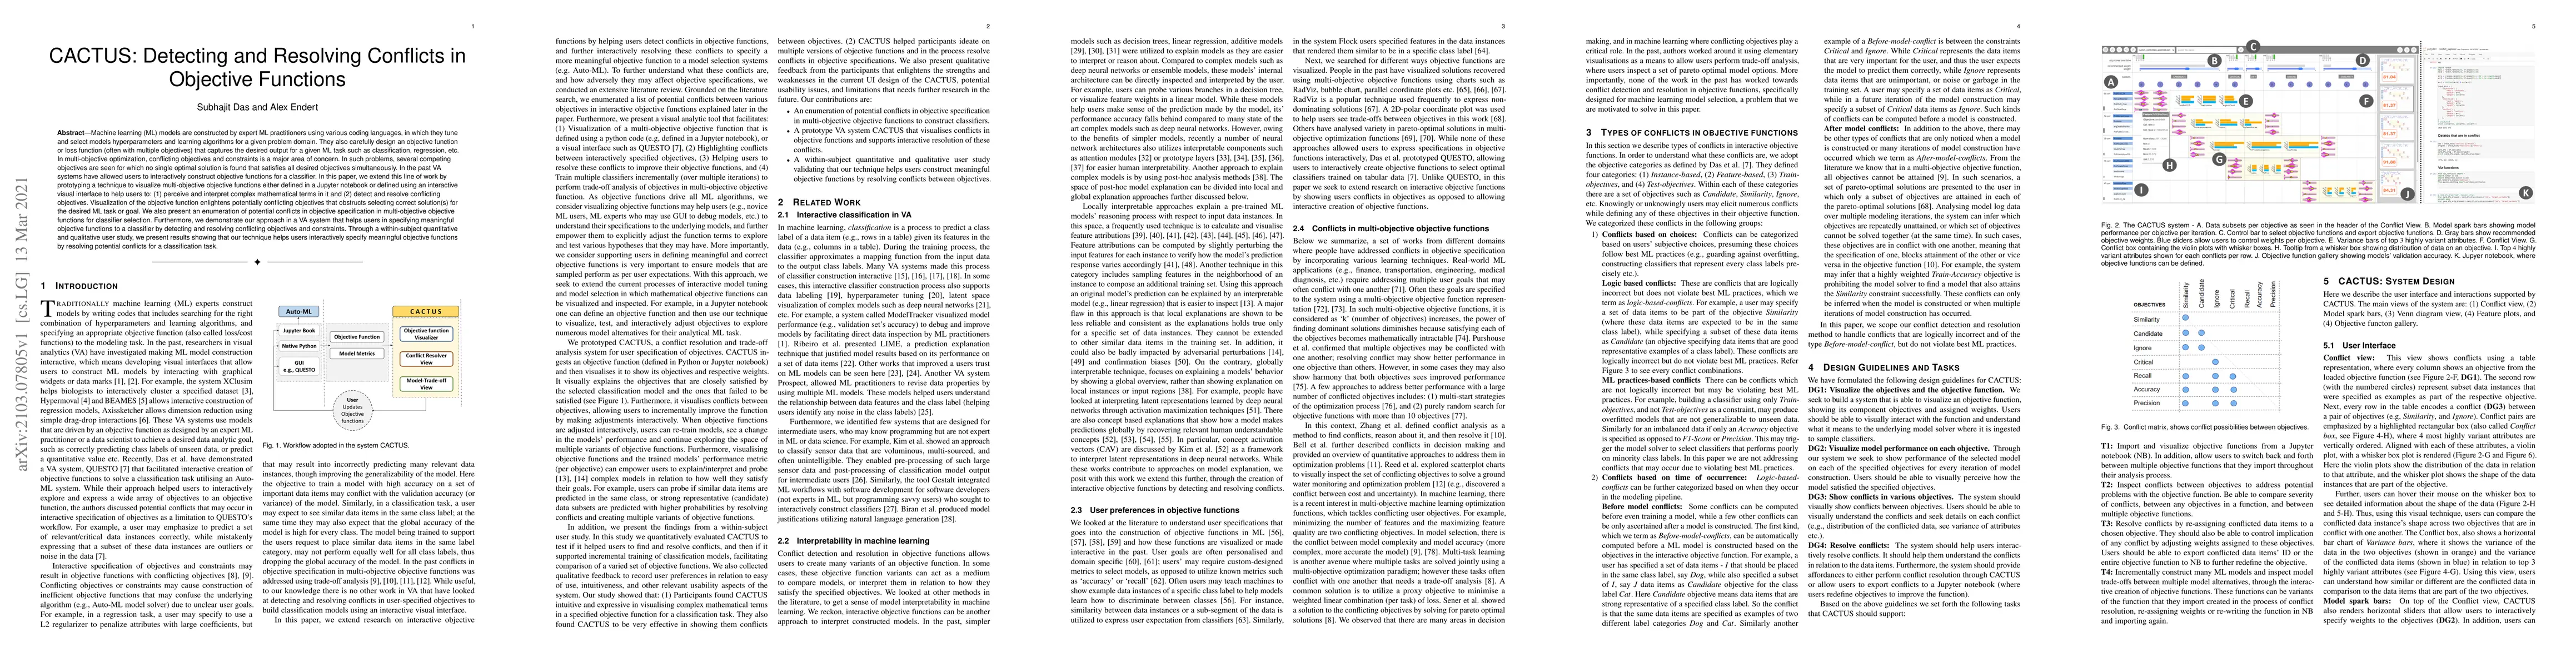
Machine learning (ML) models are constructed by expert ML practitioners using various coding languages, in which they tune and select models hyperparameters and learning algorithms for a given probl...
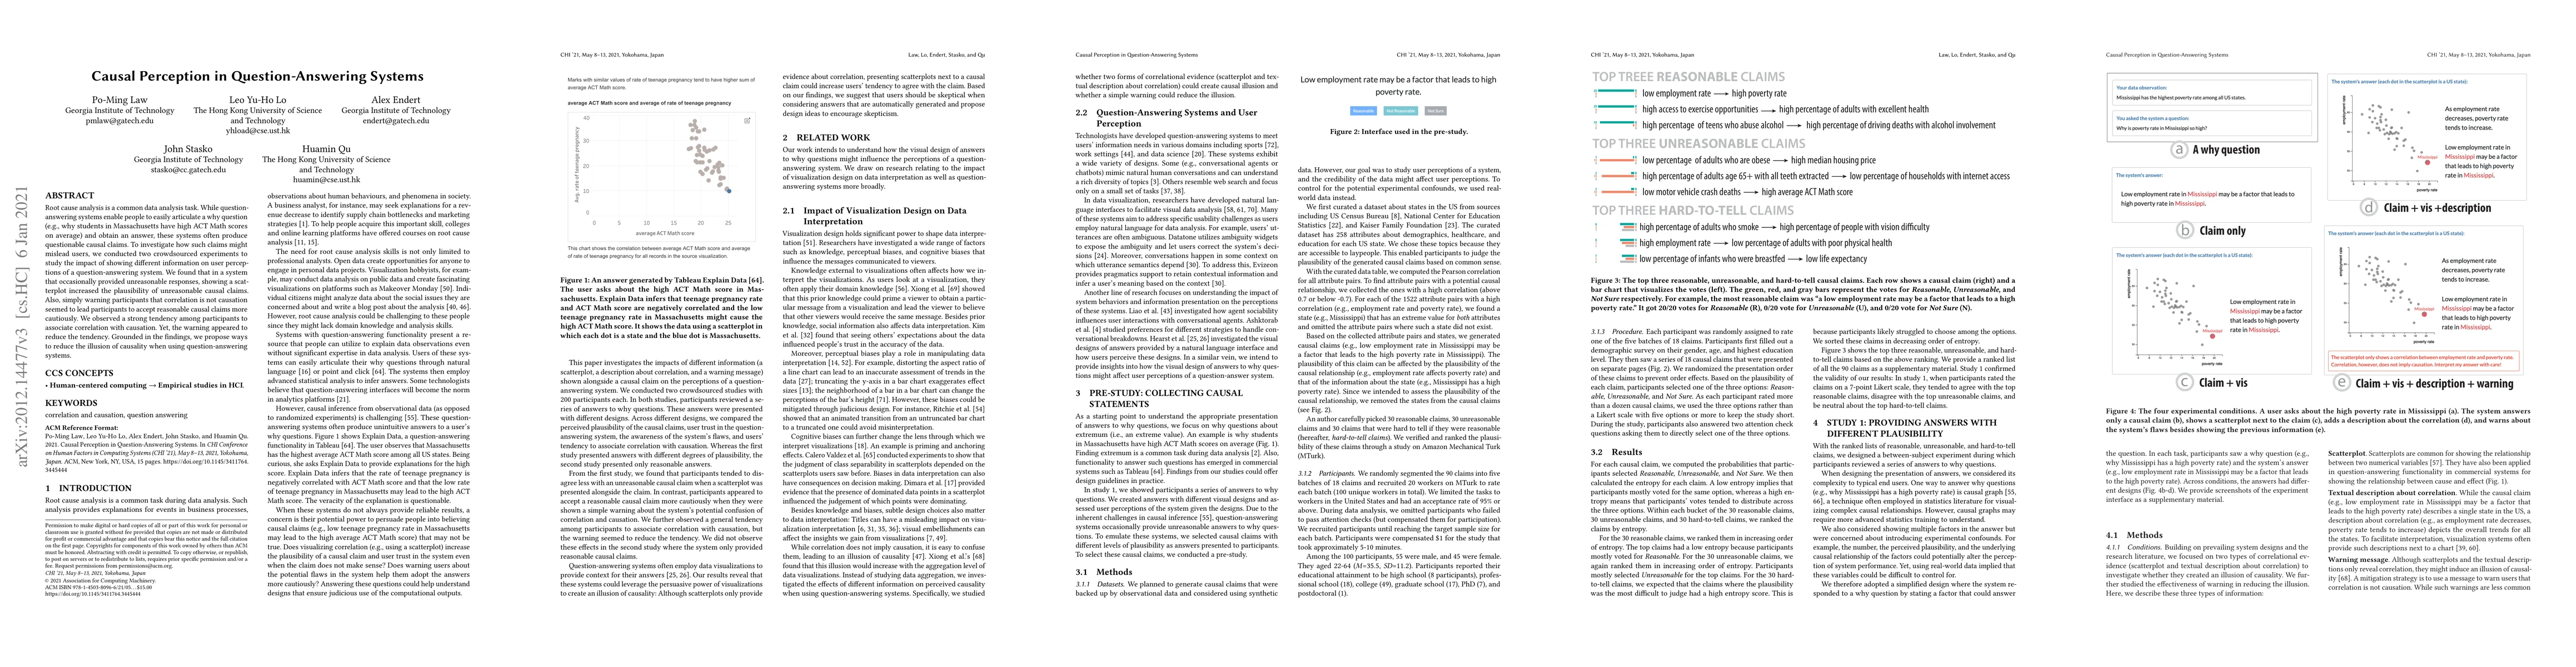
Root cause analysis is a common data analysis task. While question-answering systems enable people to easily articulate a why question (e.g., why students in Massachusetts have high ACT Math scores ...
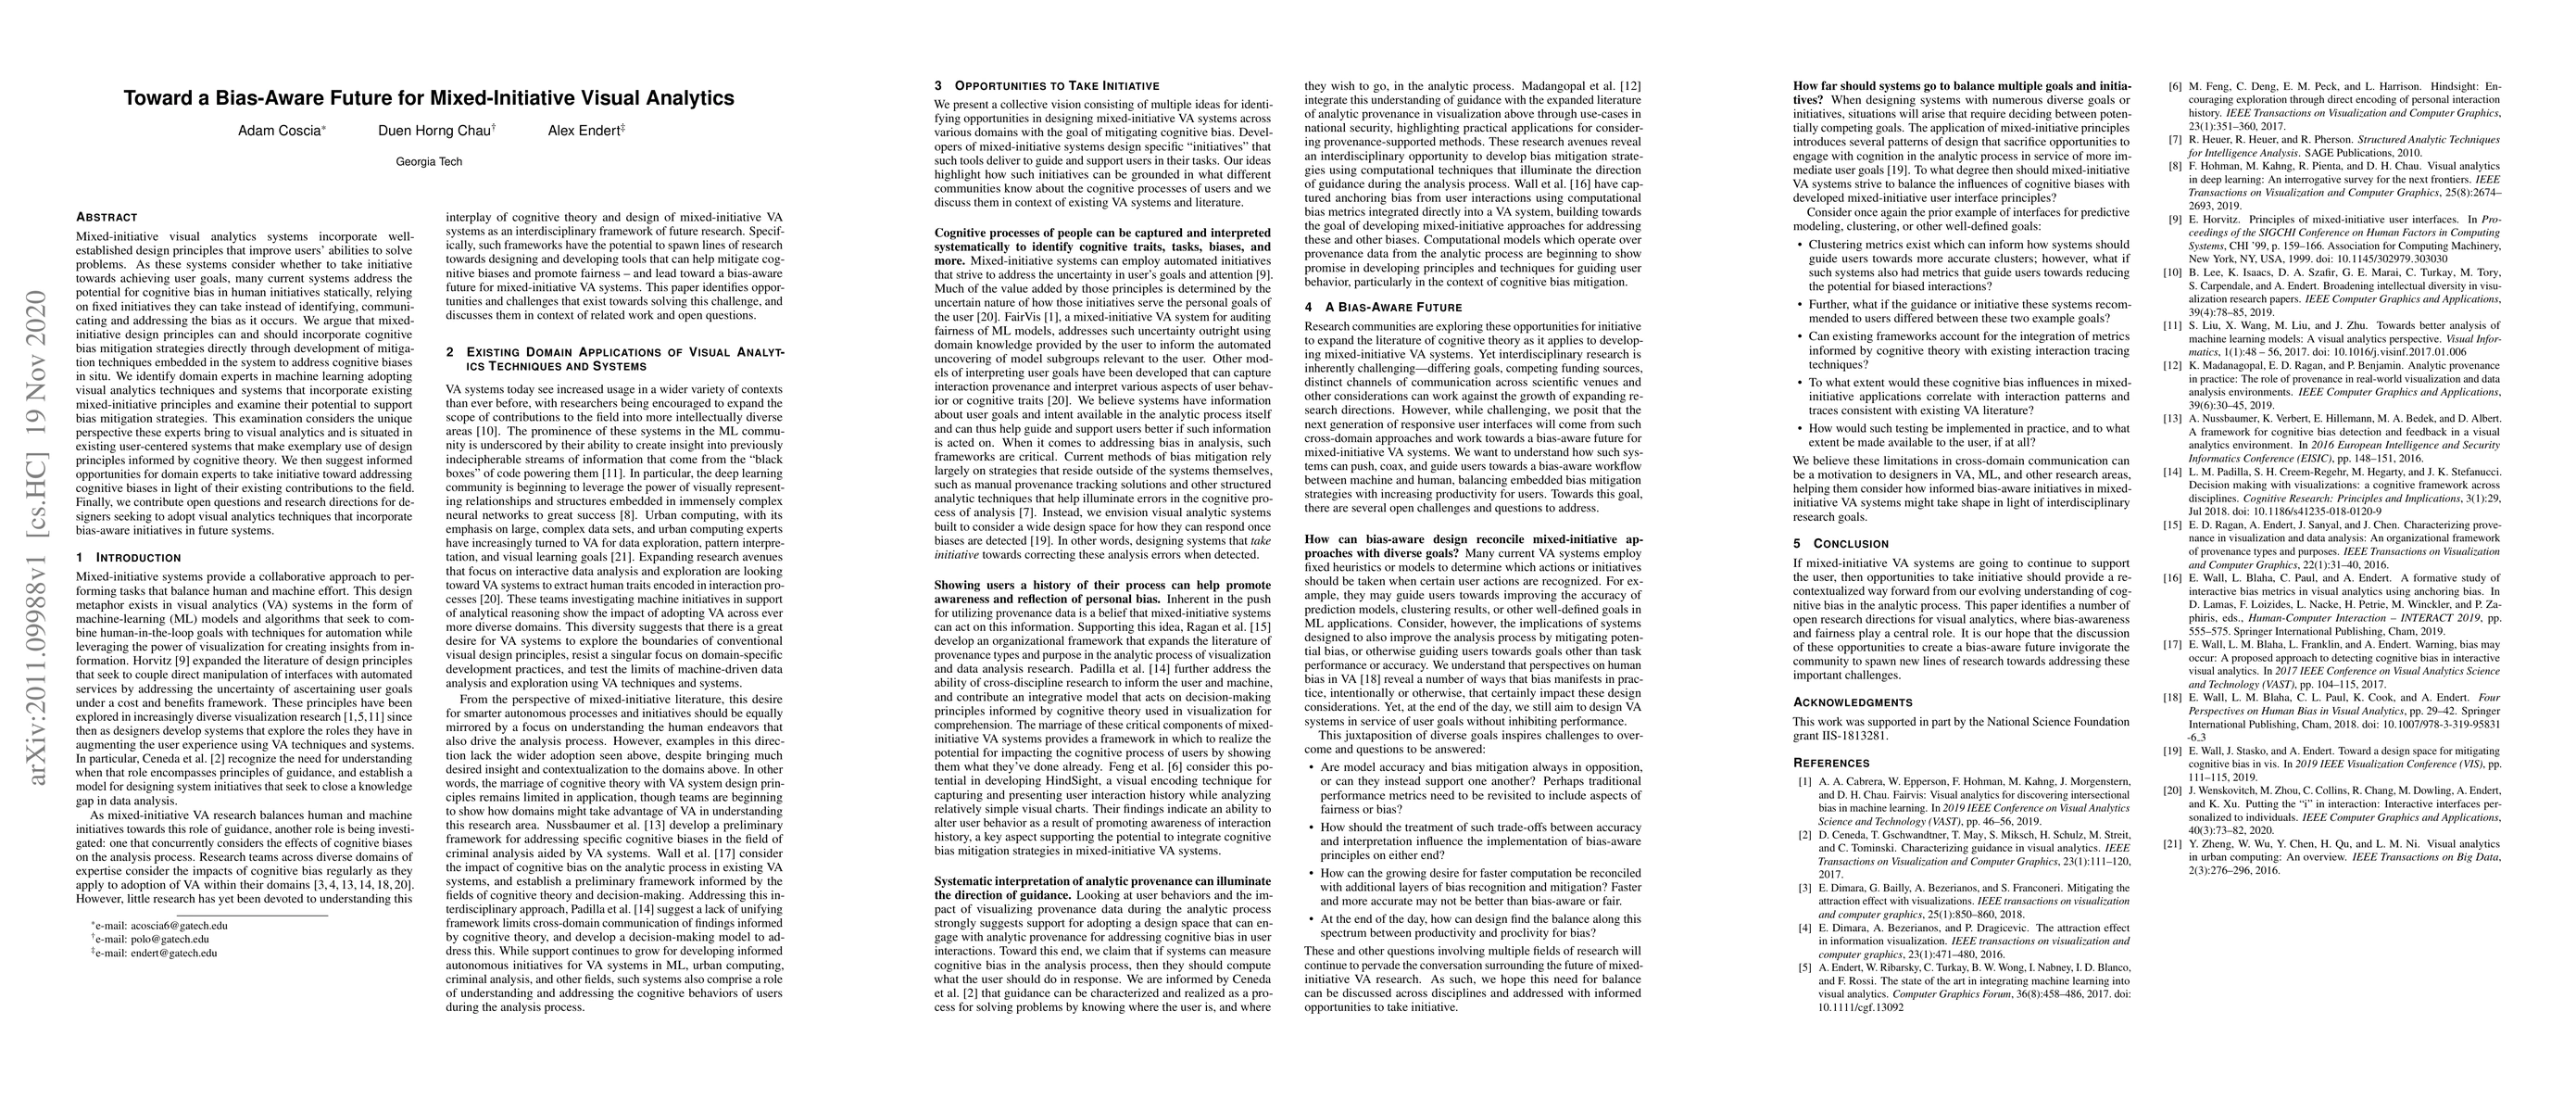
Mixed-initiative visual analytics systems incorporate well-established design principles that improve users' abilities to solve problems. As these systems consider whether to take initiative towards...
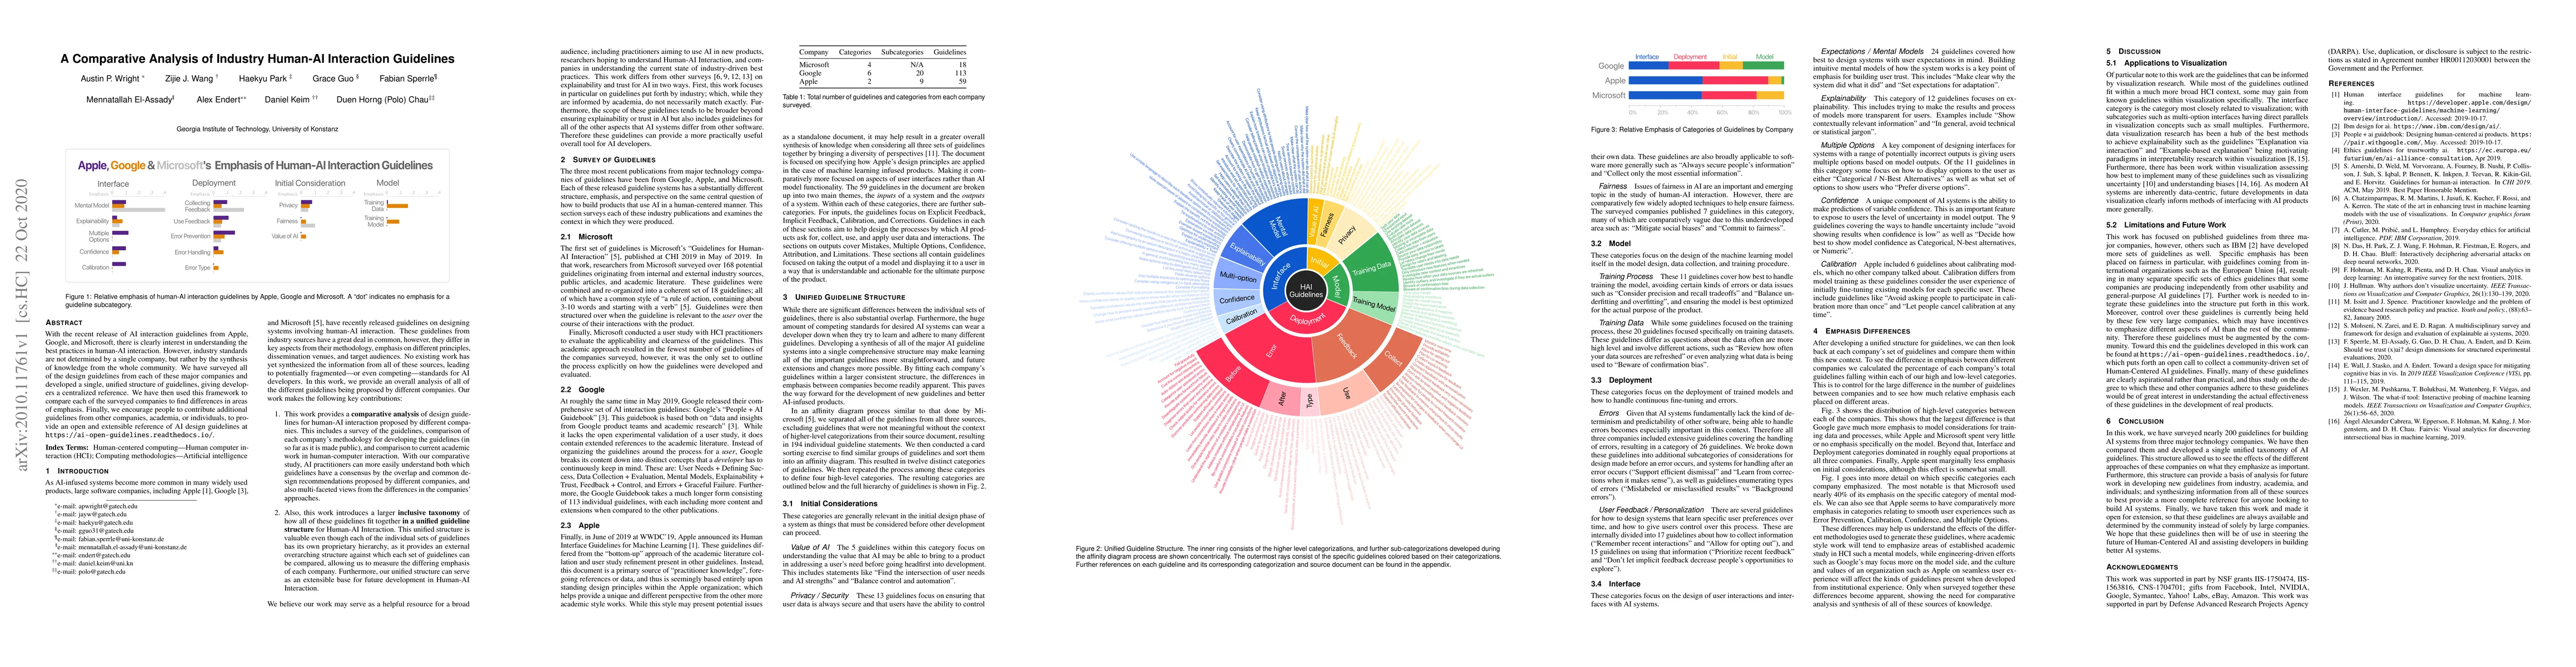
With the recent release of AI interaction guidelines from Apple, Google, and Microsoft, there is clearly interest in understanding the best practices in human-AI interaction. However, industry stand...
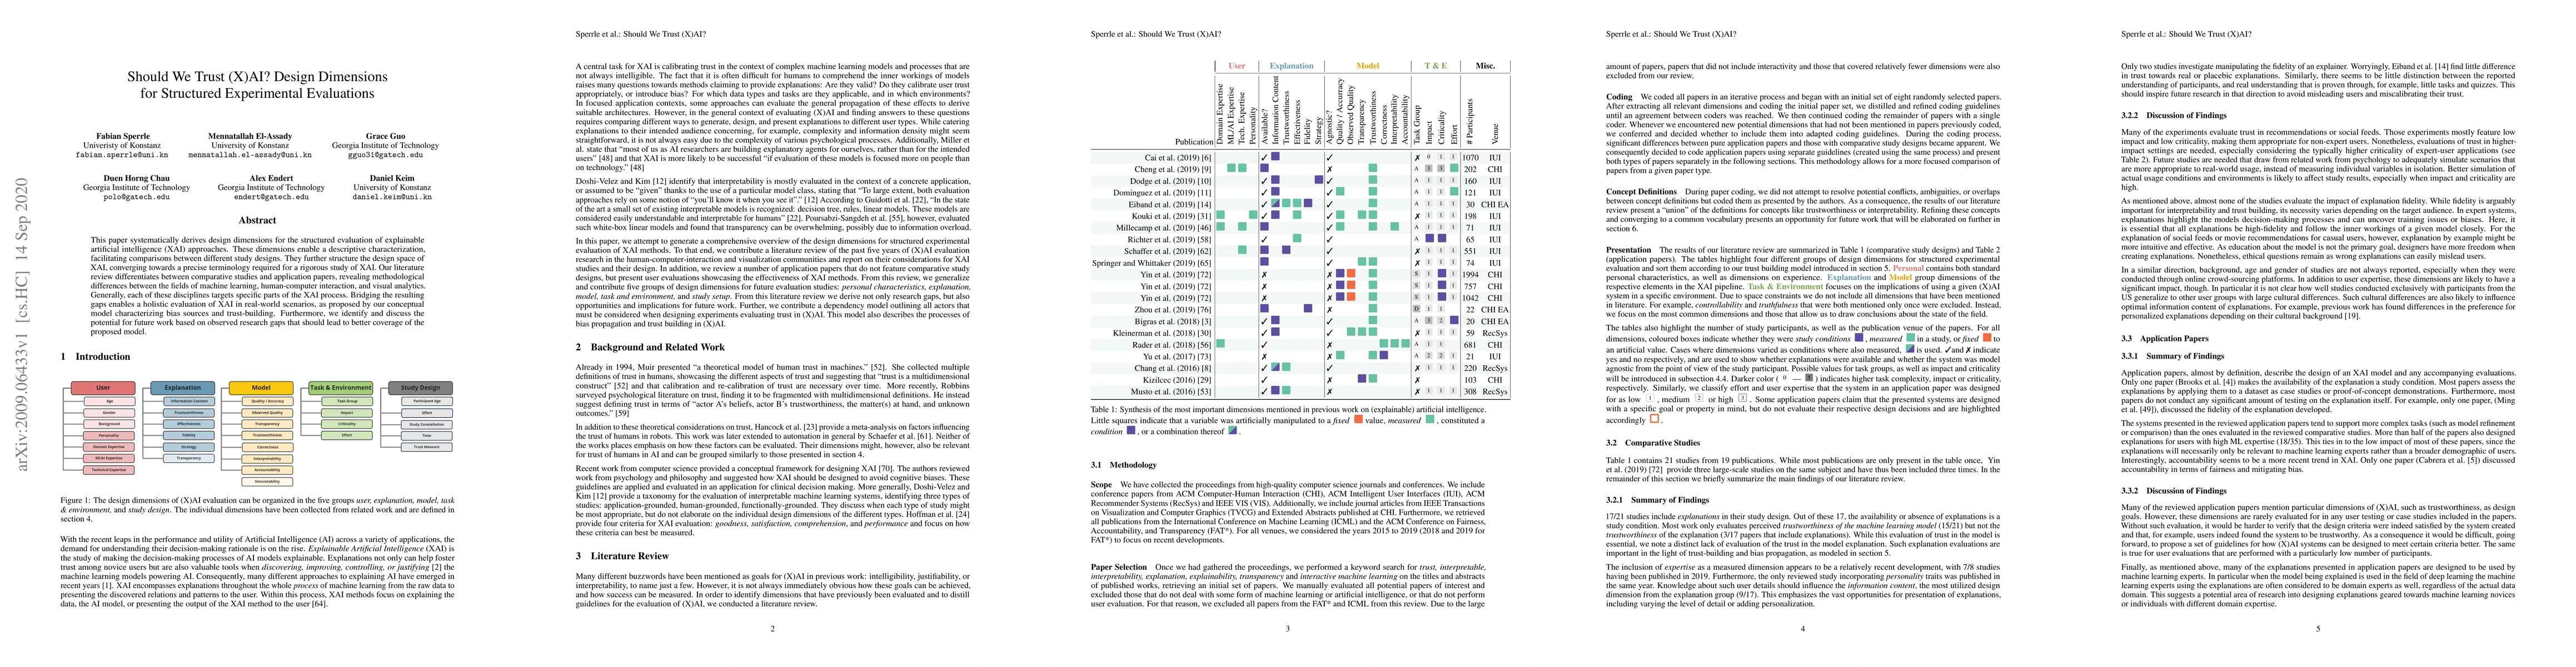
This paper systematically derives design dimensions for the structured evaluation of explainable artificial intelligence (XAI) approaches. These dimensions enable a descriptive characterization, fac...
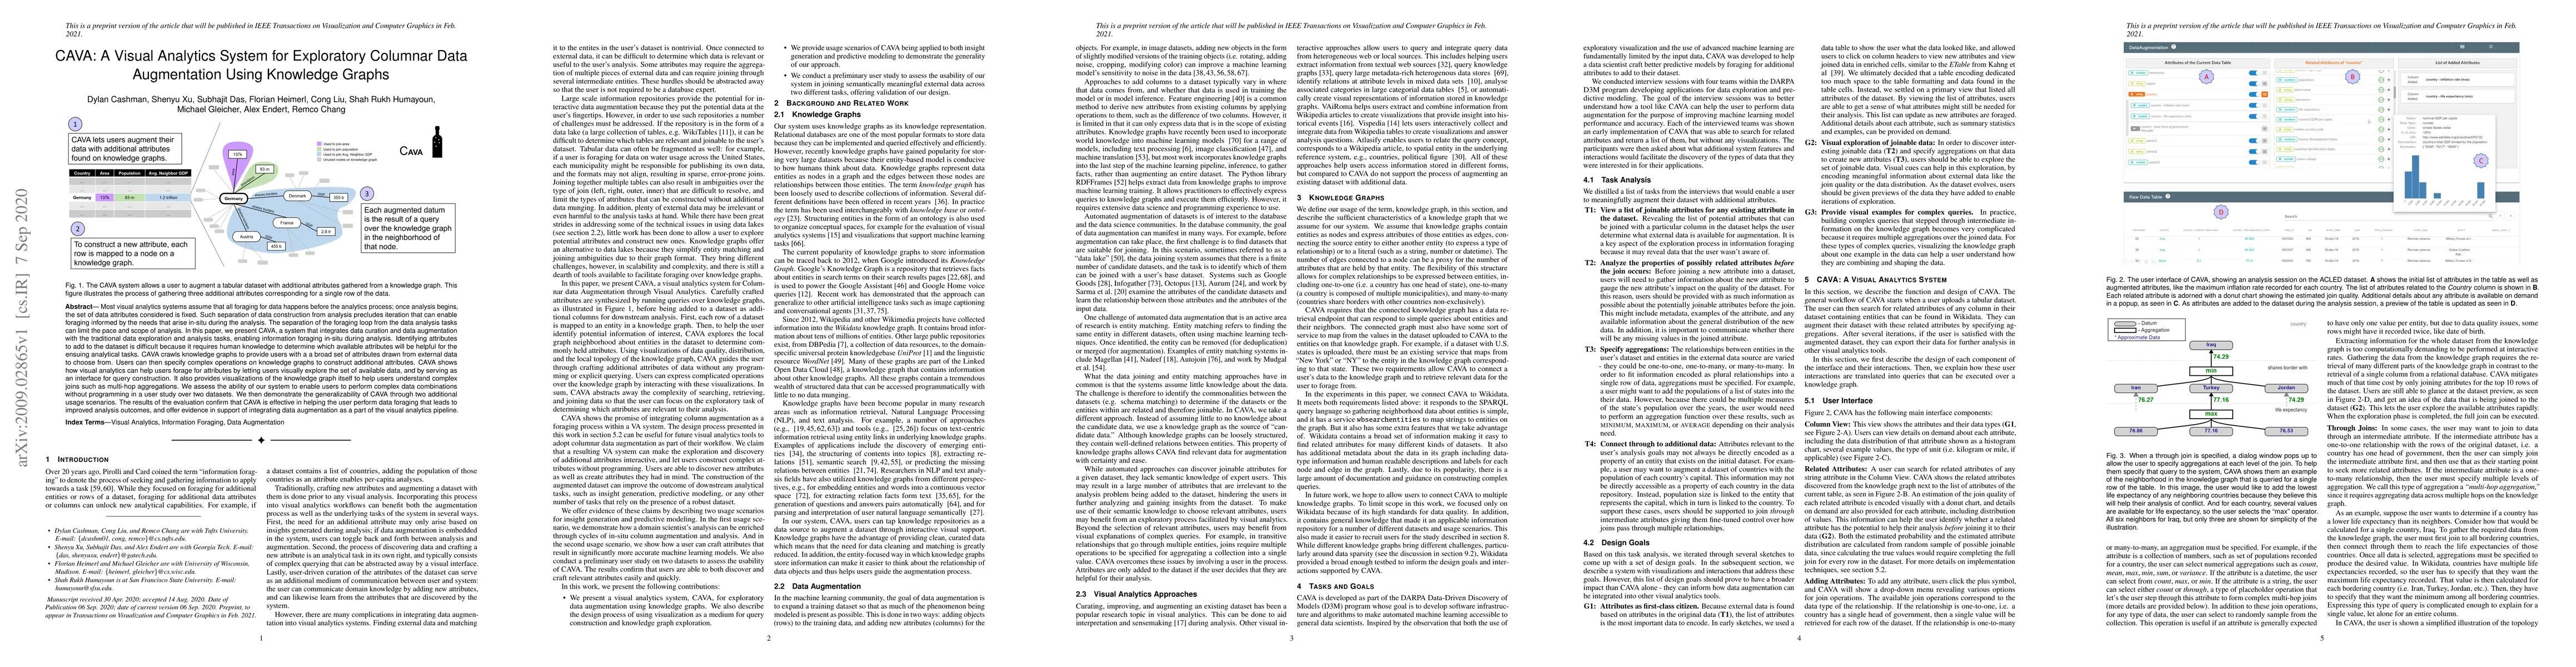
Most visual analytics systems assume that all foraging for data happens before the analytics process; once analysis begins, the set of data attributes considered is fixed. Such separation of data co...
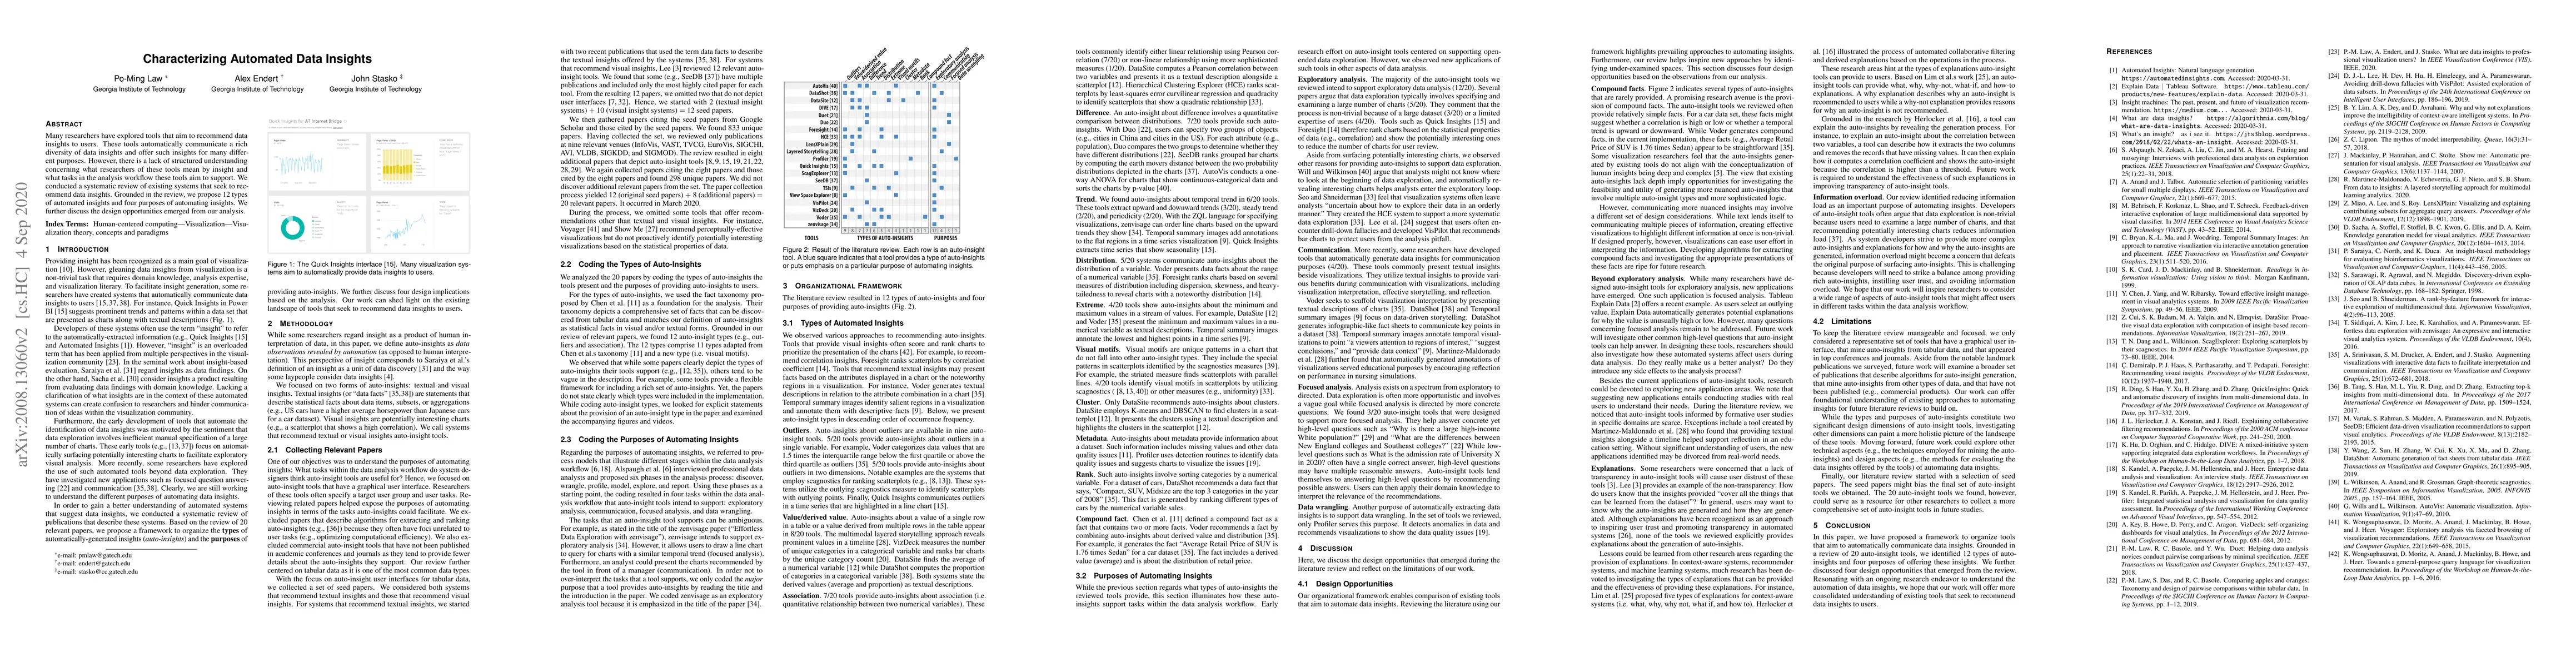
Many researchers have explored tools that aim to recommend data insights to users. These tools automatically communicate a rich diversity of data insights and offer such insights for many different ...
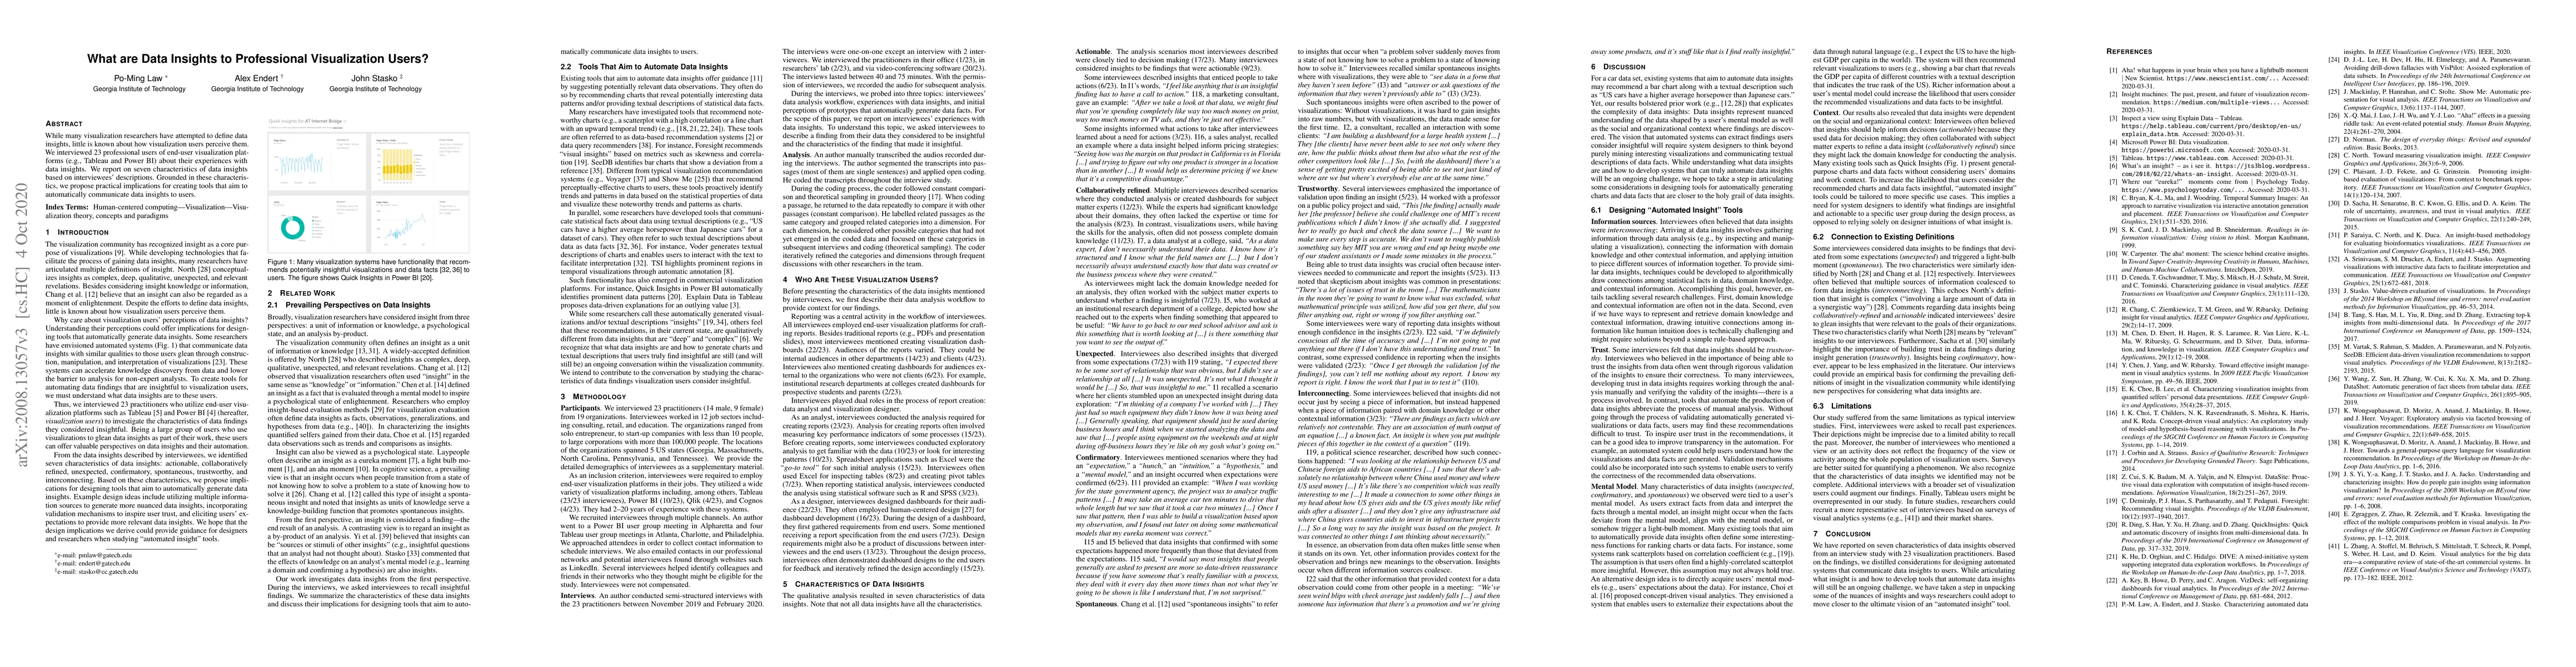
While many visualization researchers have attempted to define data insights, little is known about how visualization users perceive them. We interviewed 23 professional users of end-user visualizati...
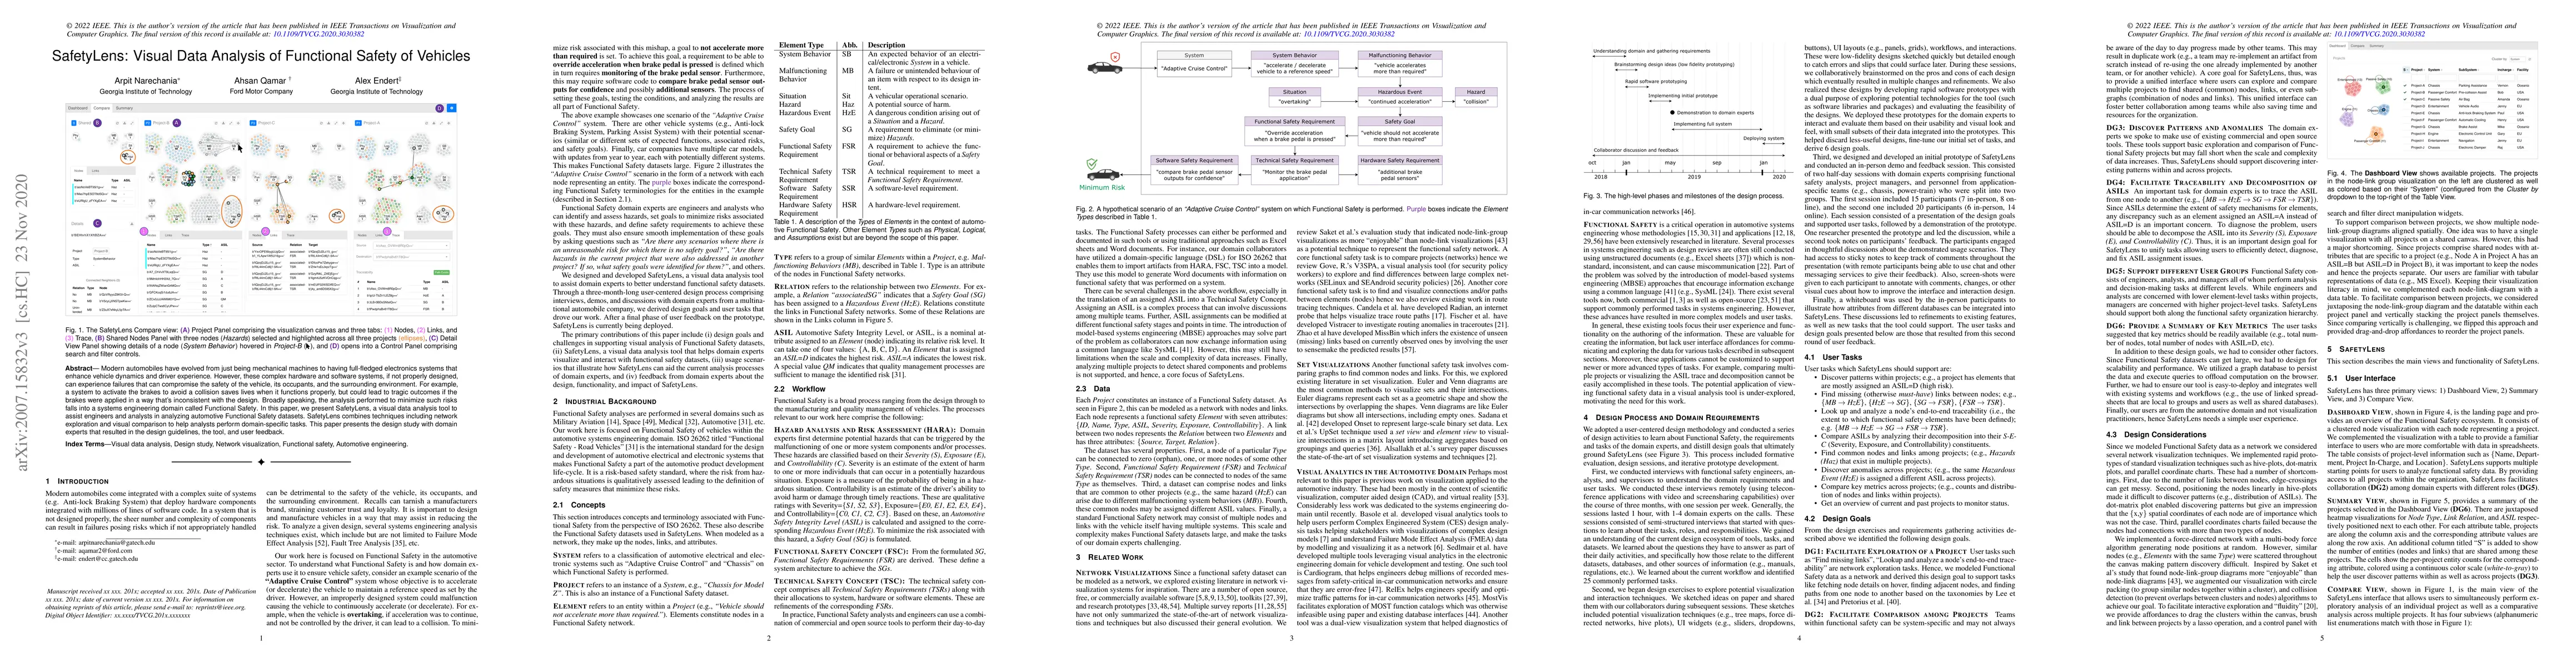
Modern automobiles have evolved from just being mechanical machines to having full-fledged electronics systems that enhance vehicle dynamics and driver experience. However, these complex hardware an...
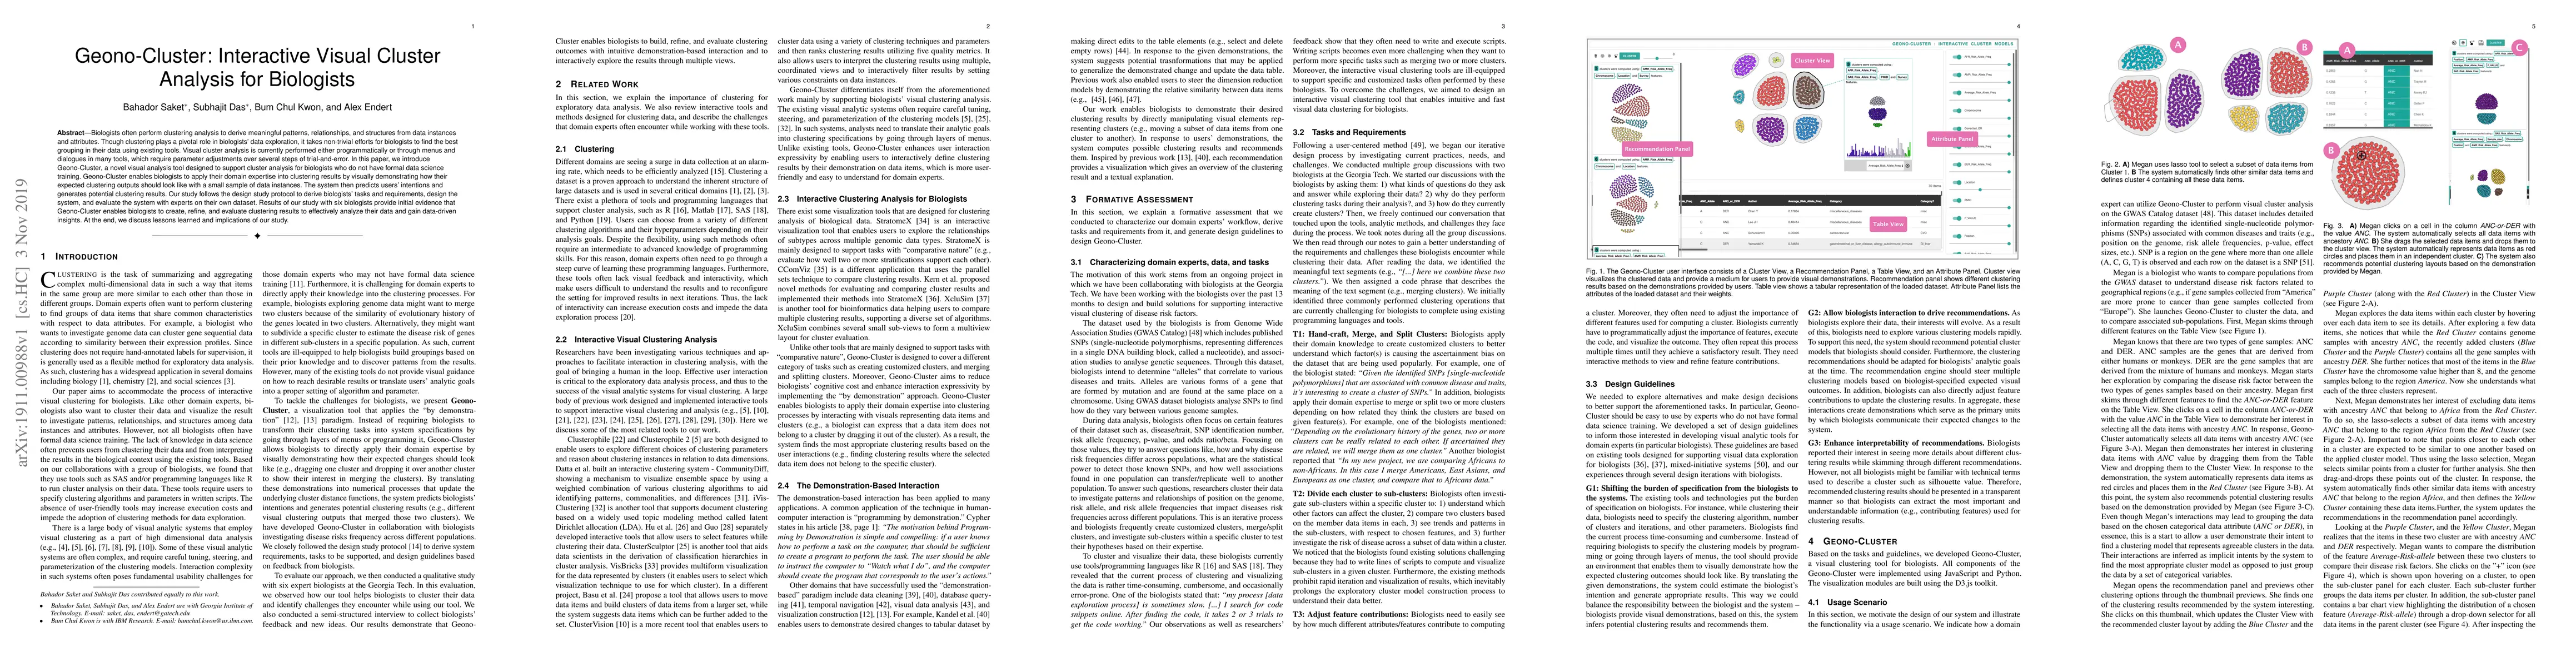
Biologists often perform clustering analysis to derive meaningful patterns, relationships, and structures from data instances and attributes. Though clustering plays a pivotal role in biologists' da...
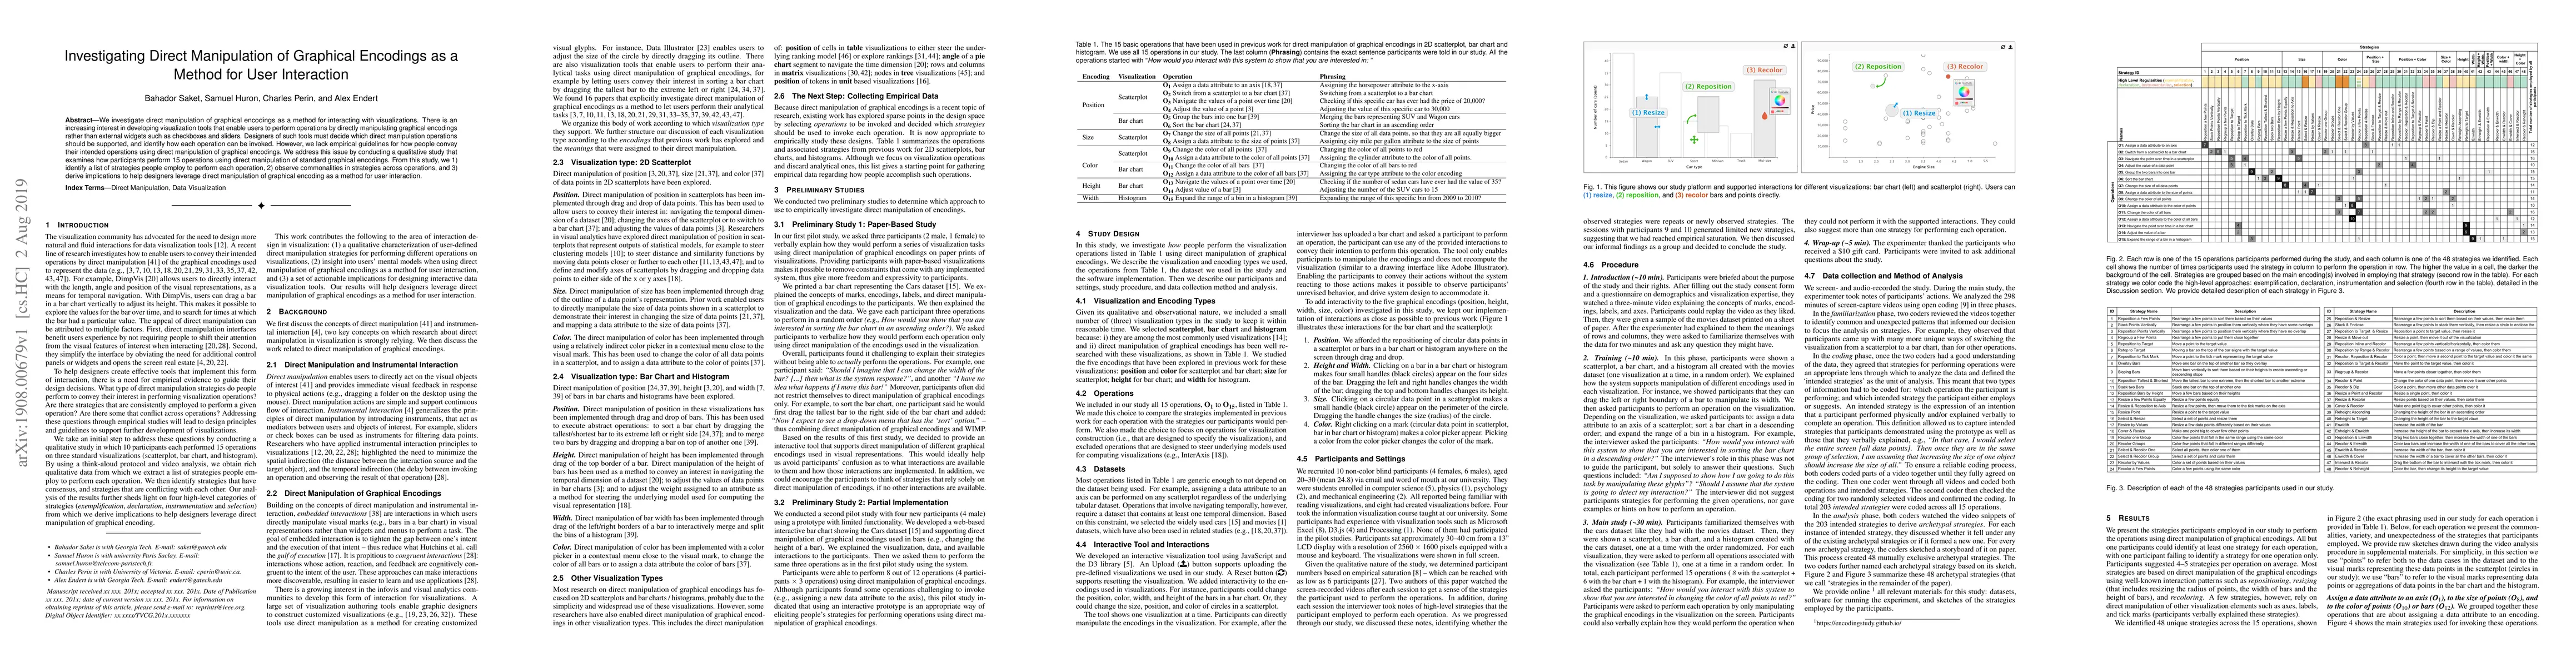
We investigate direct manipulation of graphical encodings as a method for interacting with visualizations. There is an increasing interest in developing visualization tools that enable users to perf...
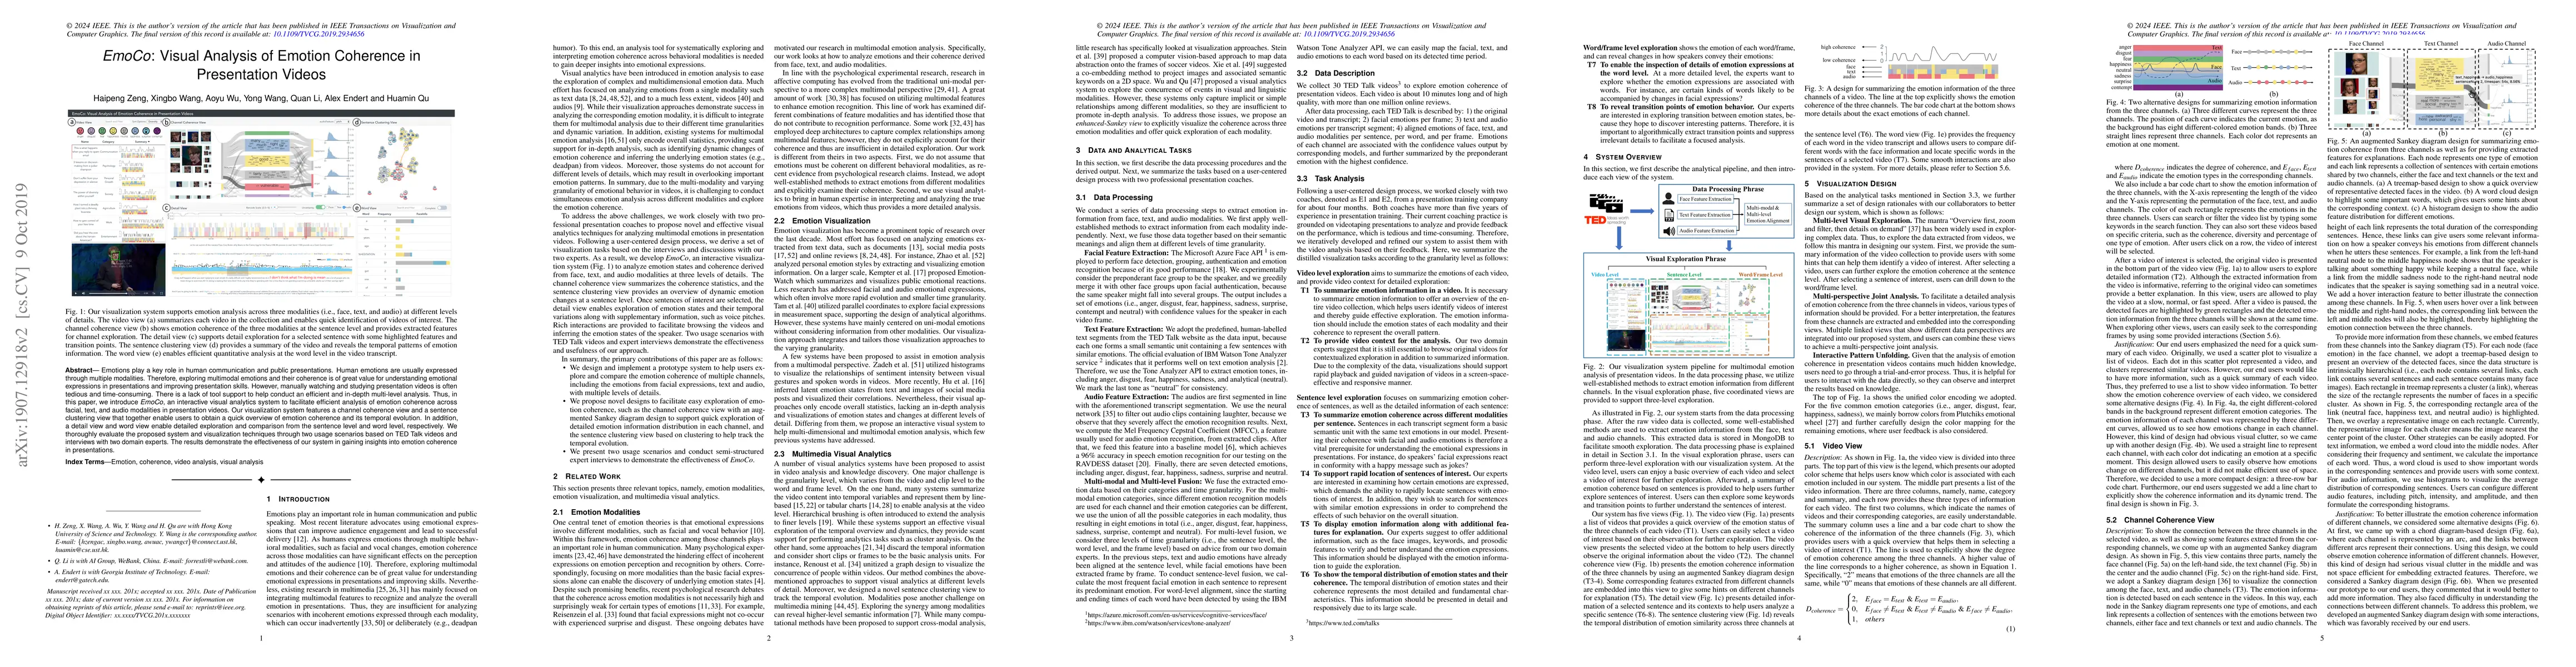
Emotions play a key role in human communication and public presentations. Human emotions are usually expressed through multiple modalities. Therefore, exploring multimodal emotions and their coheren...
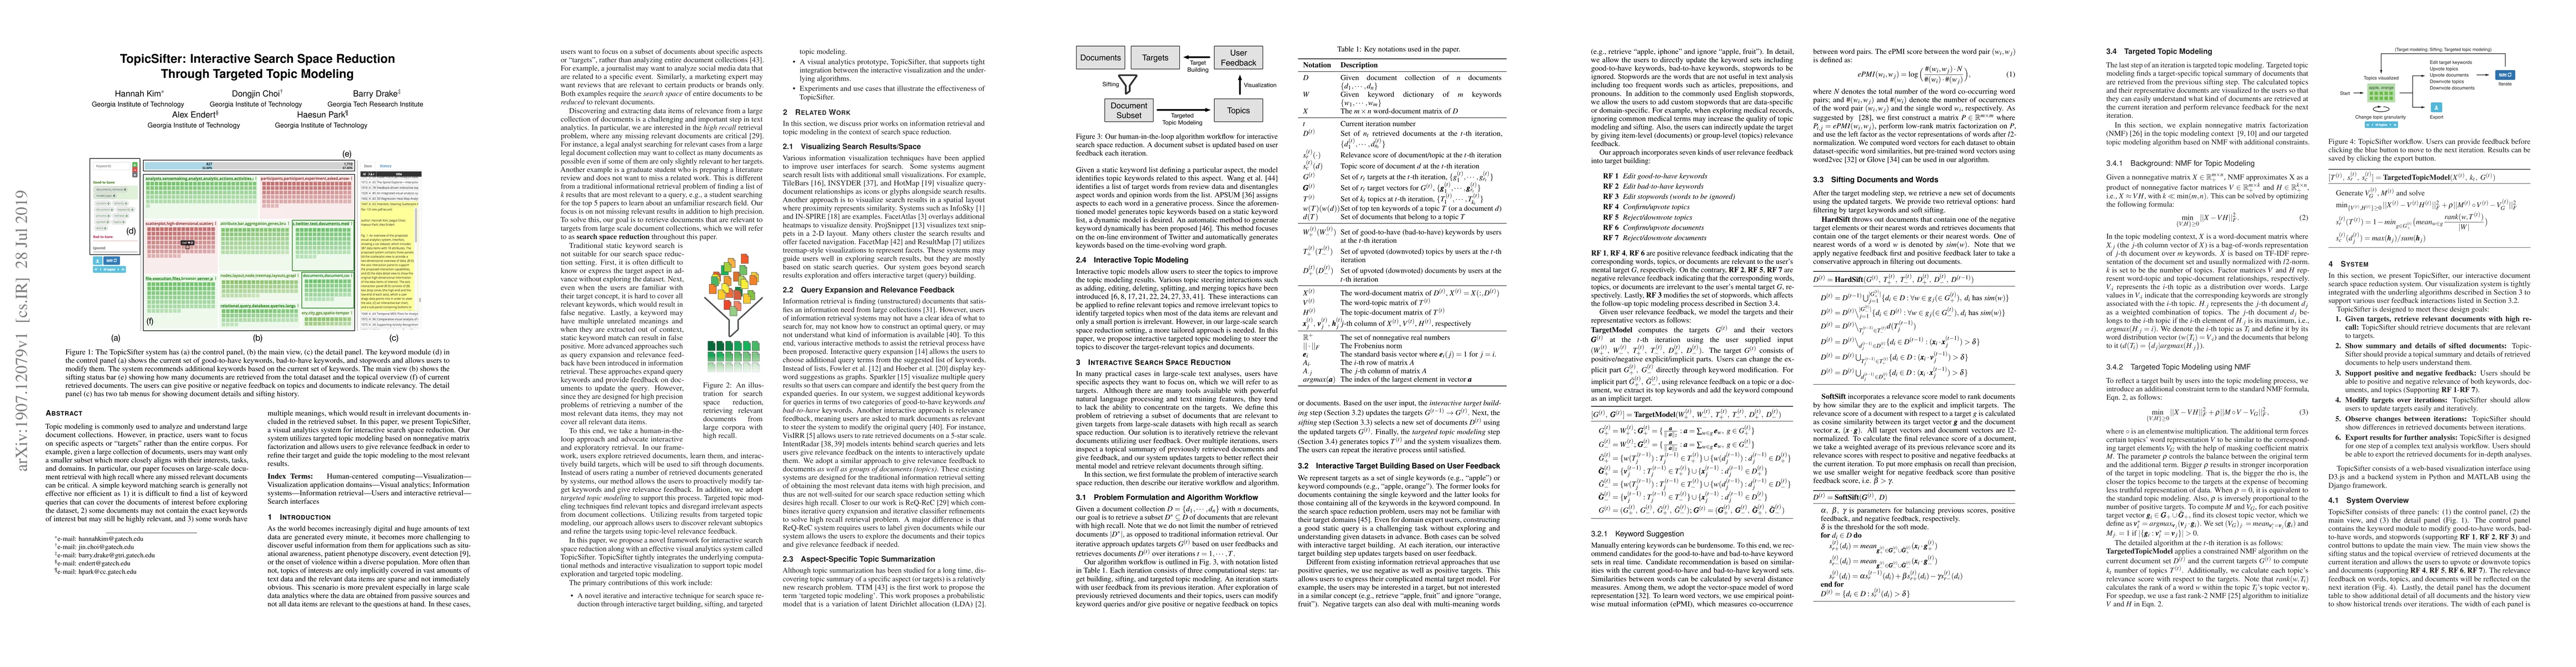
Topic modeling is commonly used to analyze and understand large document collections. However, in practice, users want to focus on specific aspects or "targets" rather than the entire corpus. For ex...
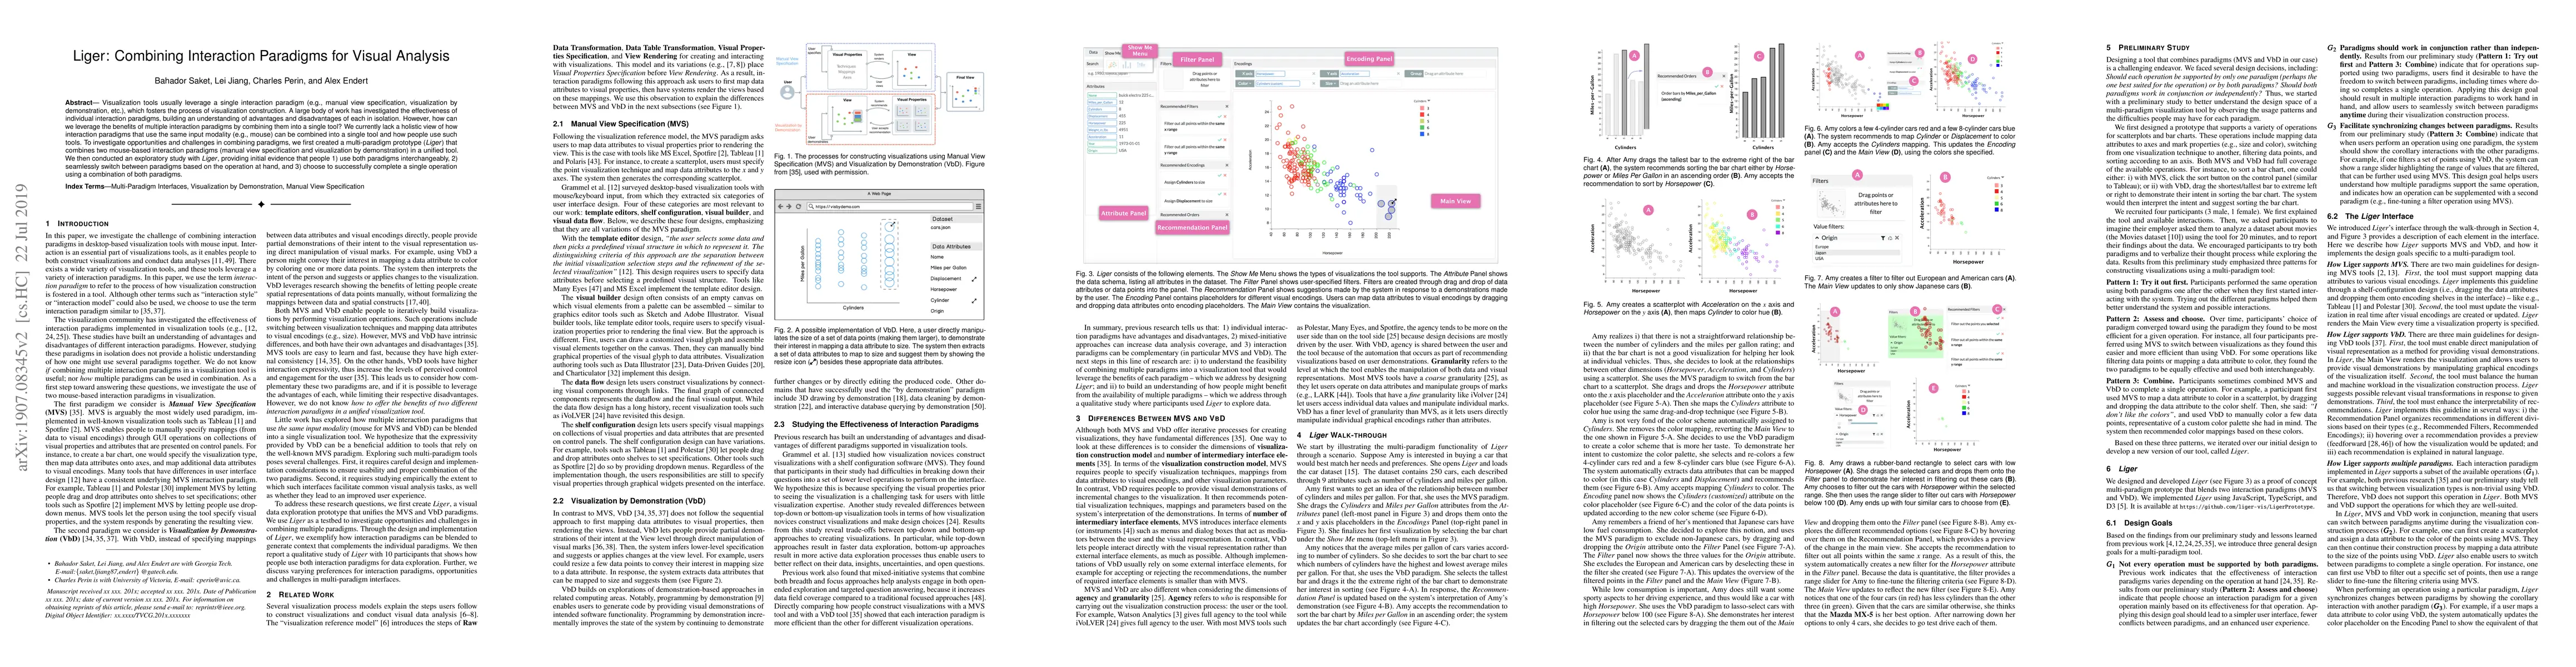
Visualization tools usually leverage a single interaction paradigm (e.g., manual view specification, visualization by demonstration, etc.), which fosters the process of visualization construction. A...
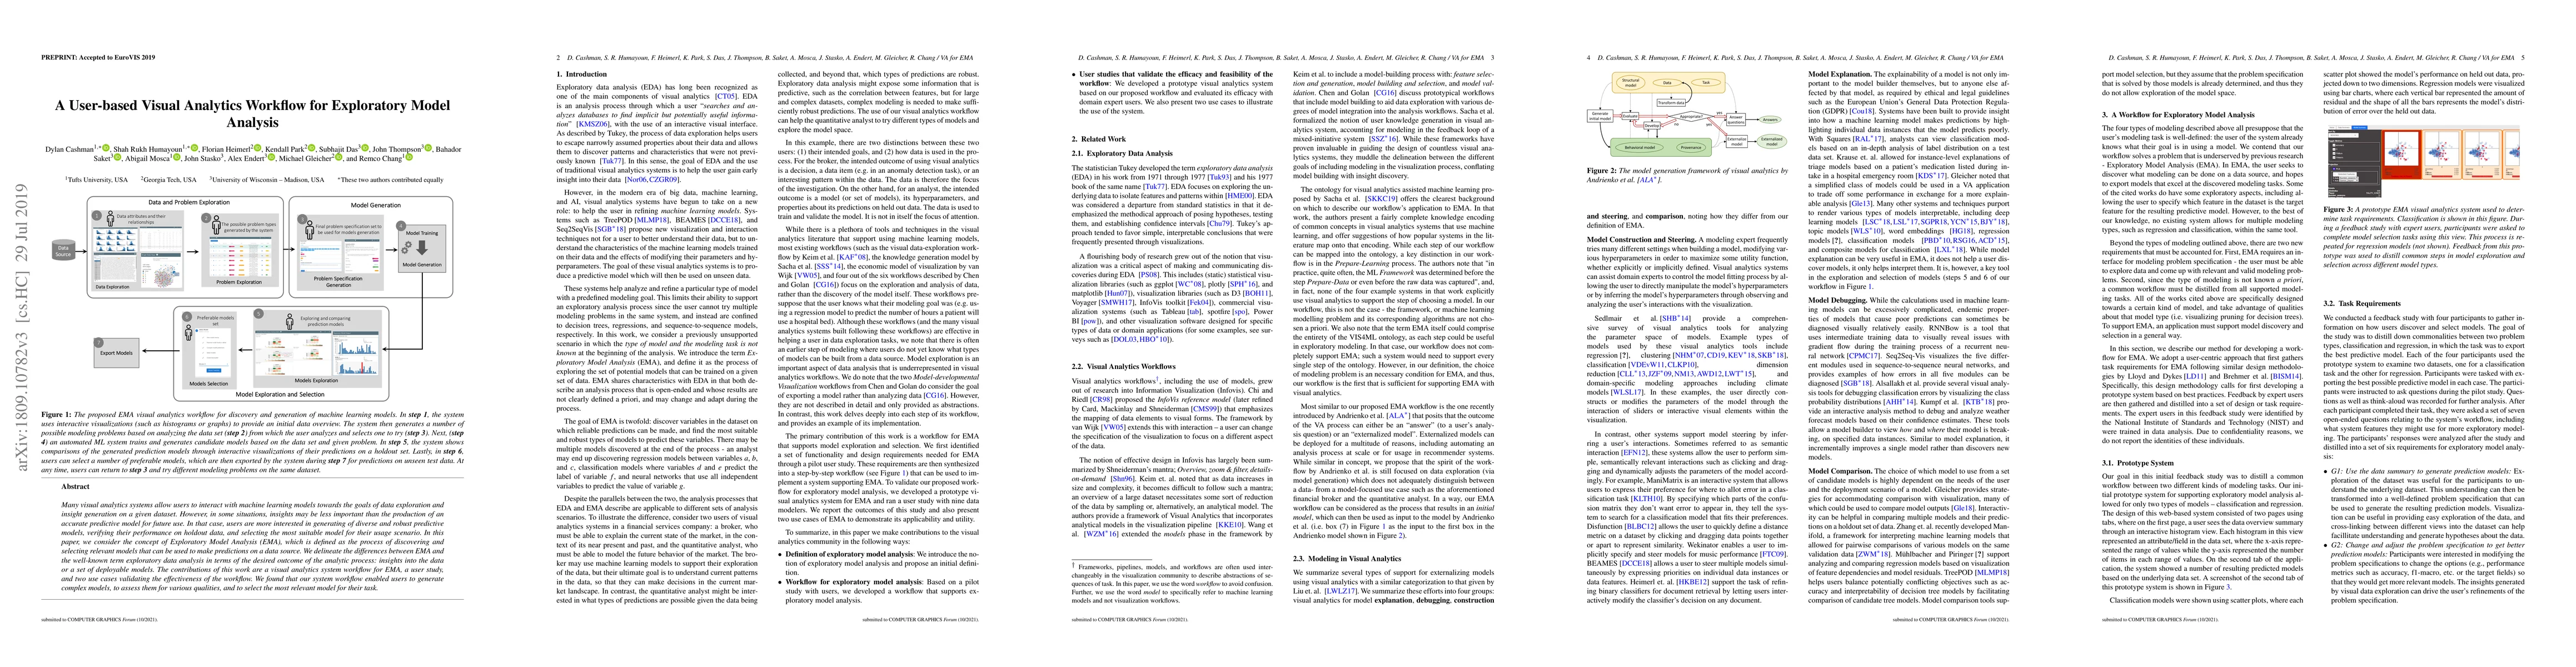
Many visual analytics systems allow users to interact with machine learning models towards the goals of data exploration and insight generation on a given dataset. However, in some situations, insig...
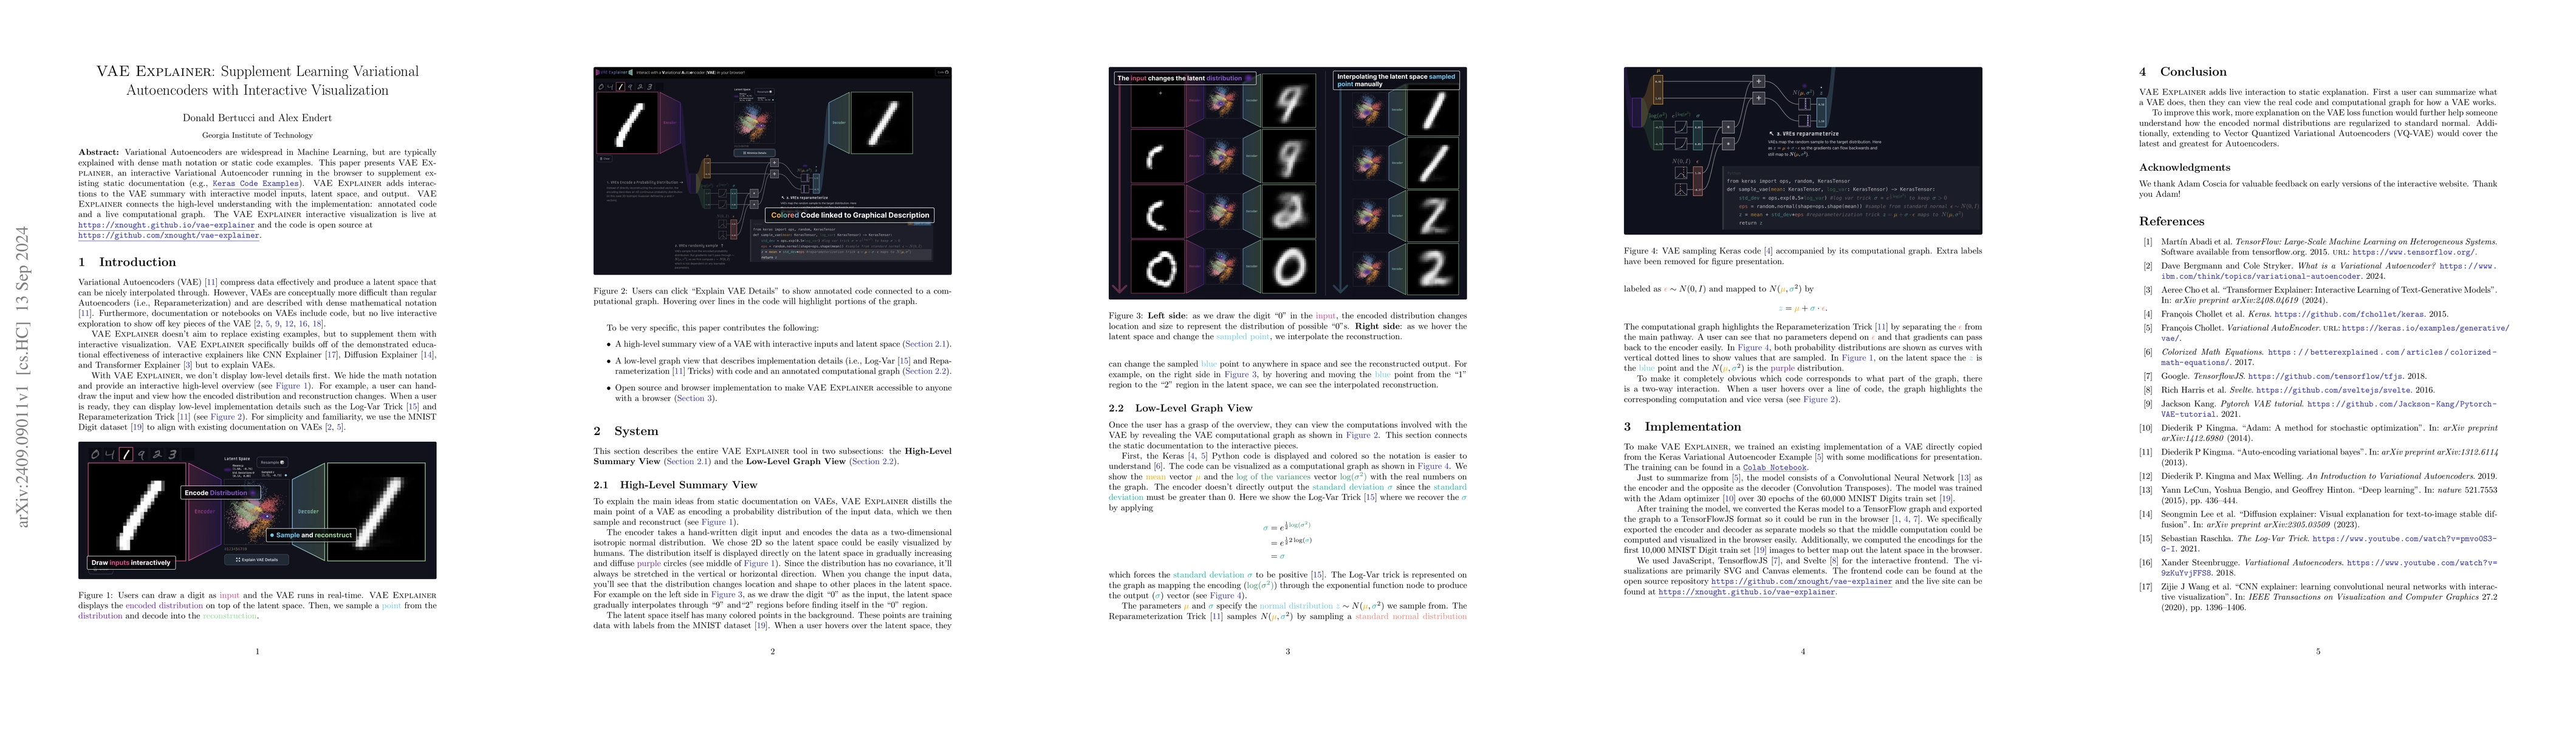
Variational Autoencoders are widespread in Machine Learning, but are typically explained with dense math notation or static code examples. This paper presents VAE Explainer, an interactive Variational...
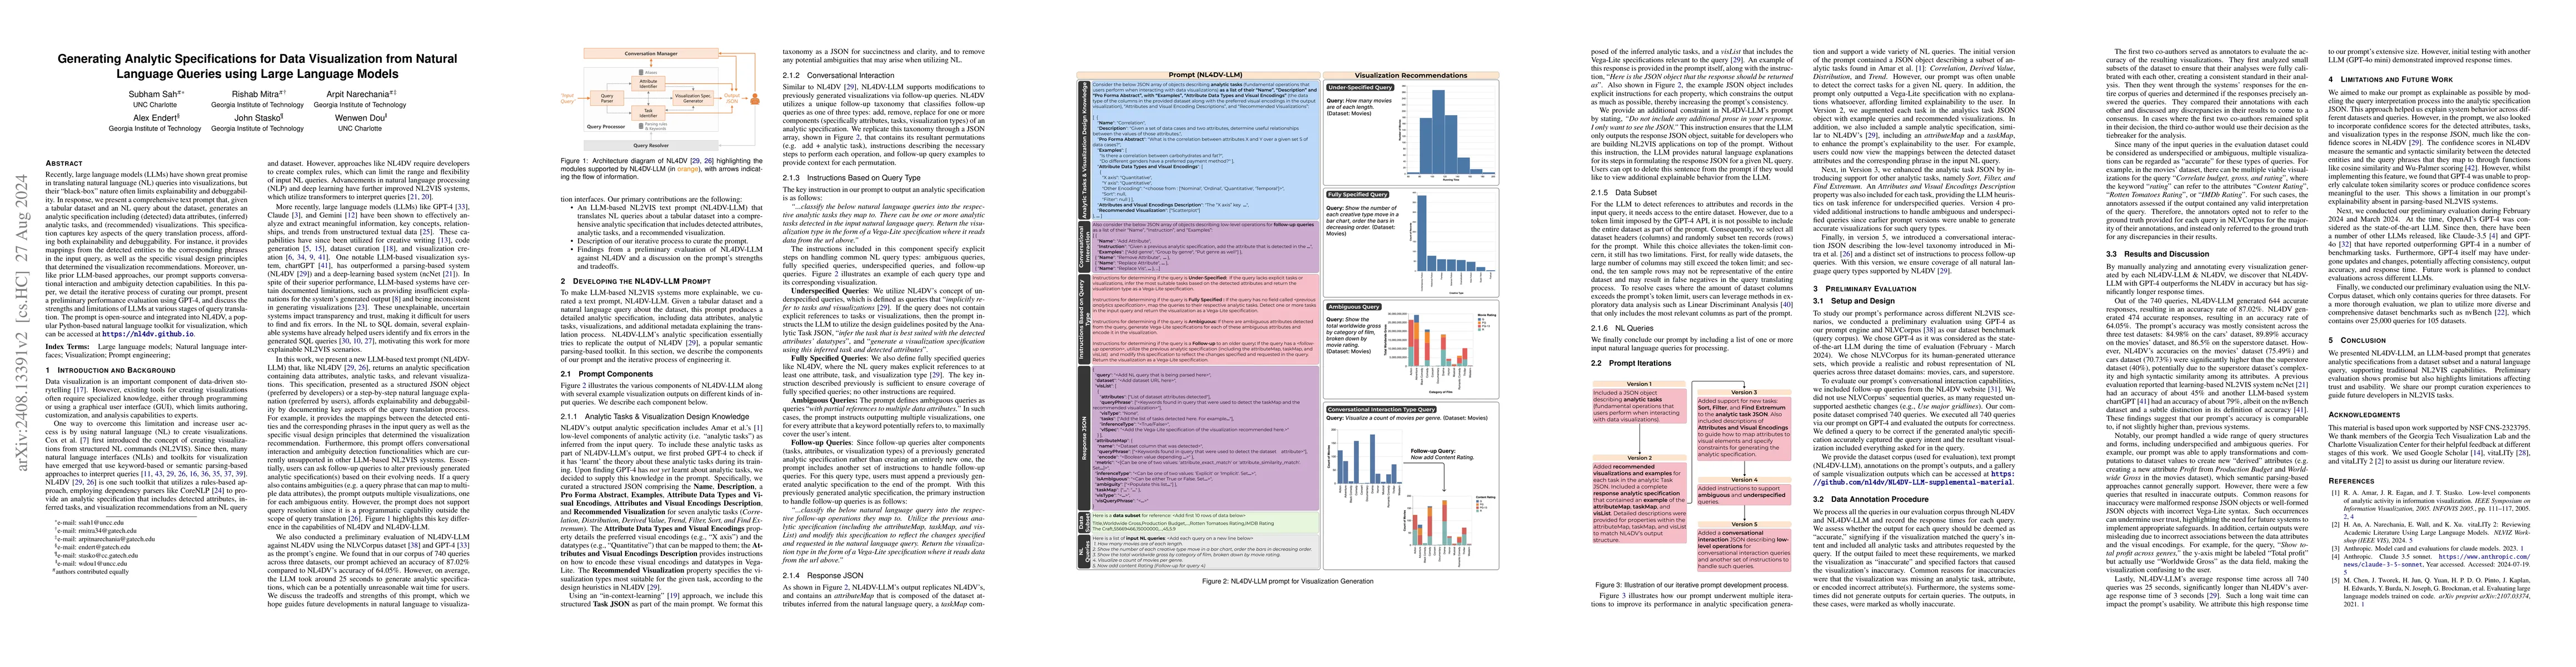
Recently, large language models (LLMs) have shown great promise in translating natural language (NL) queries into visualizations, but their "black-box" nature often limits explainability and debuggabi...
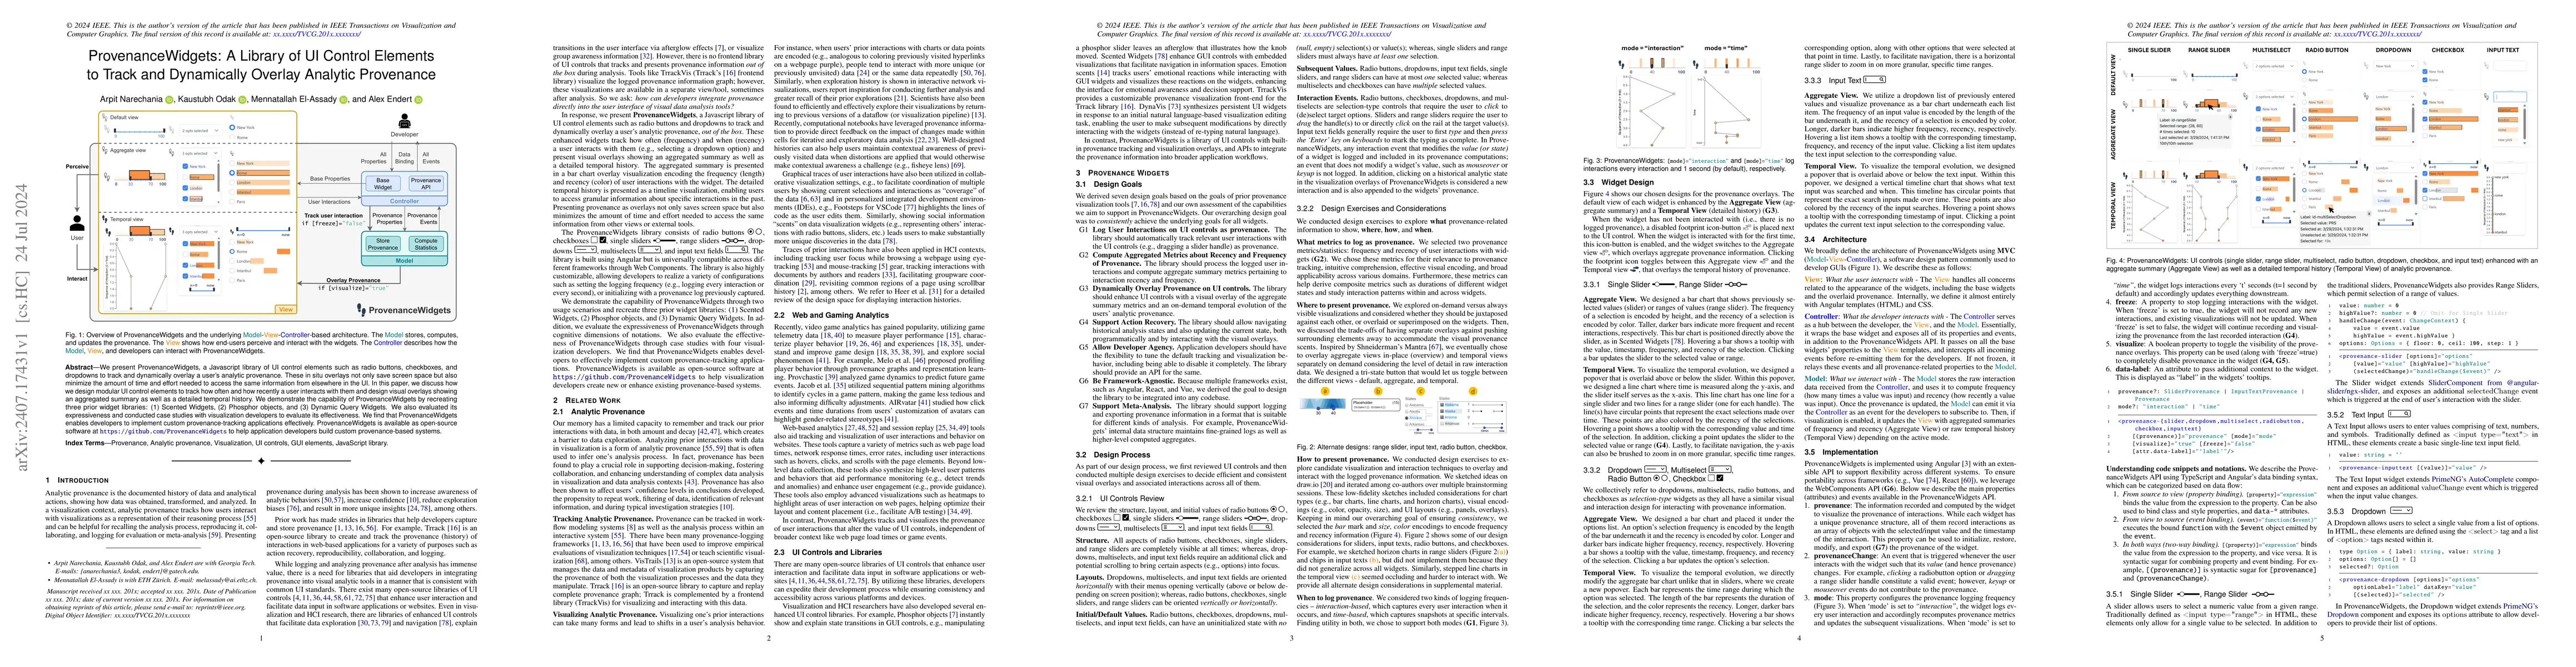
We present ProvenanceWidgets, a Javascript library of UI control elements such as radio buttons, checkboxes, and dropdowns to track and dynamically overlay a user's analytic provenance. These in situ ...
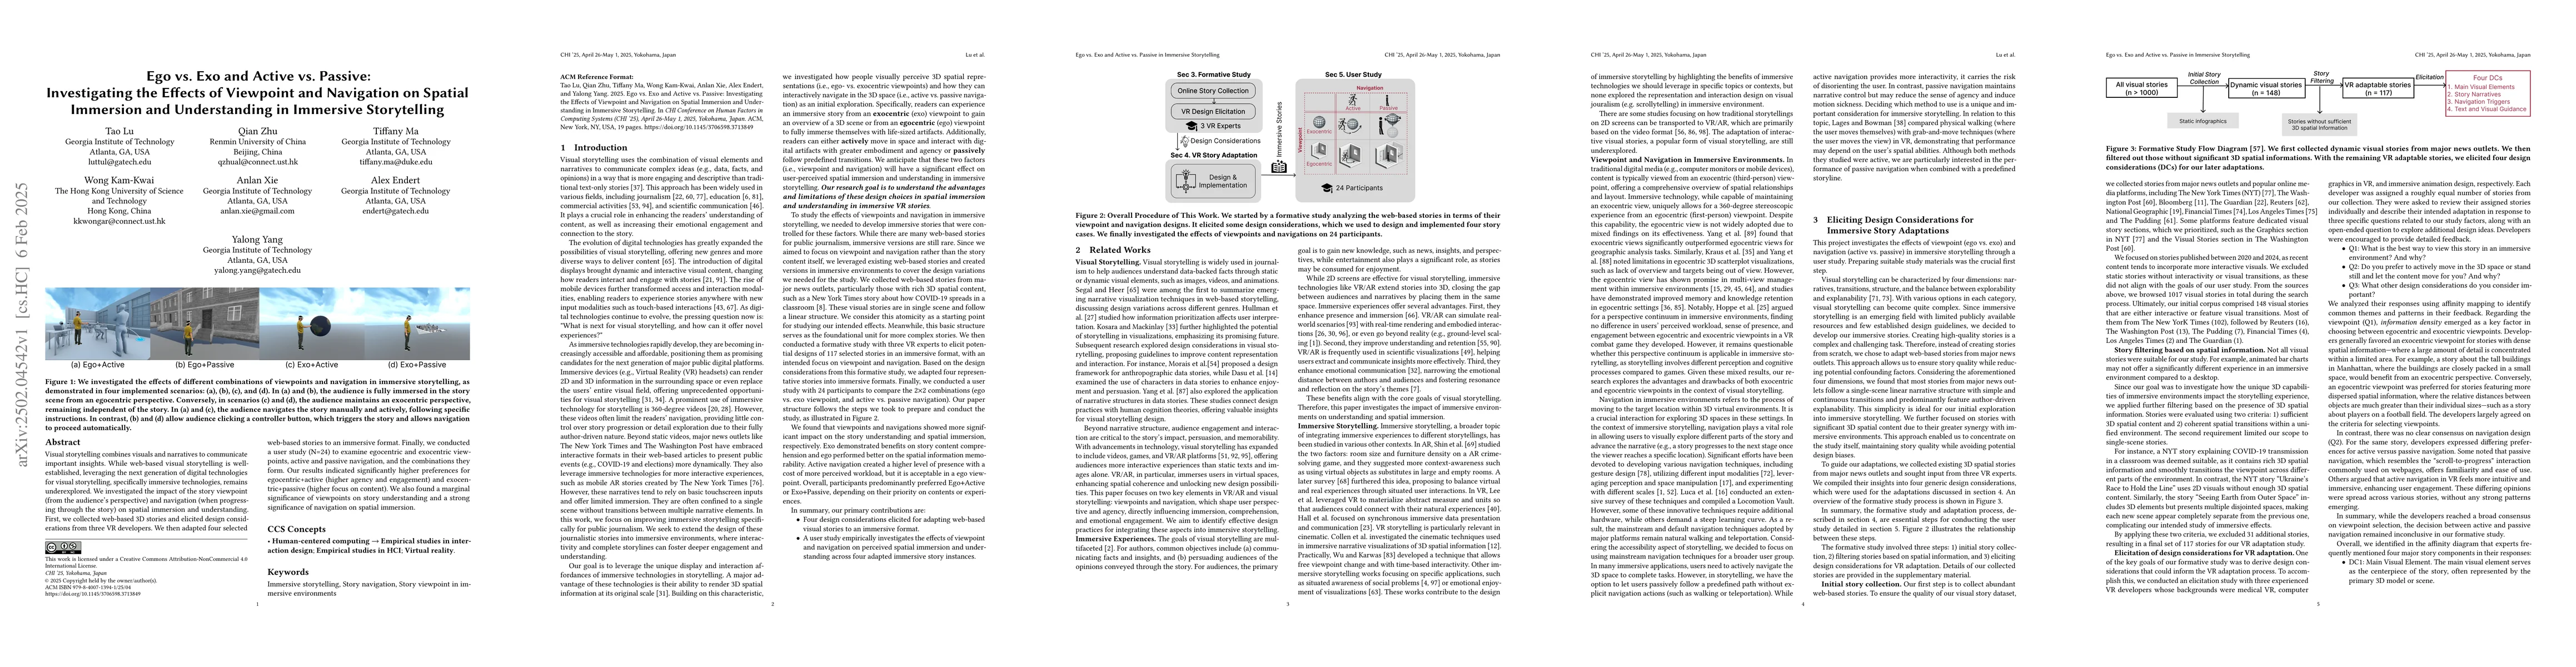
Visual storytelling combines visuals and narratives to communicate important insights. While web-based visual storytelling is well-established, leveraging the next generation of digital technologies f...
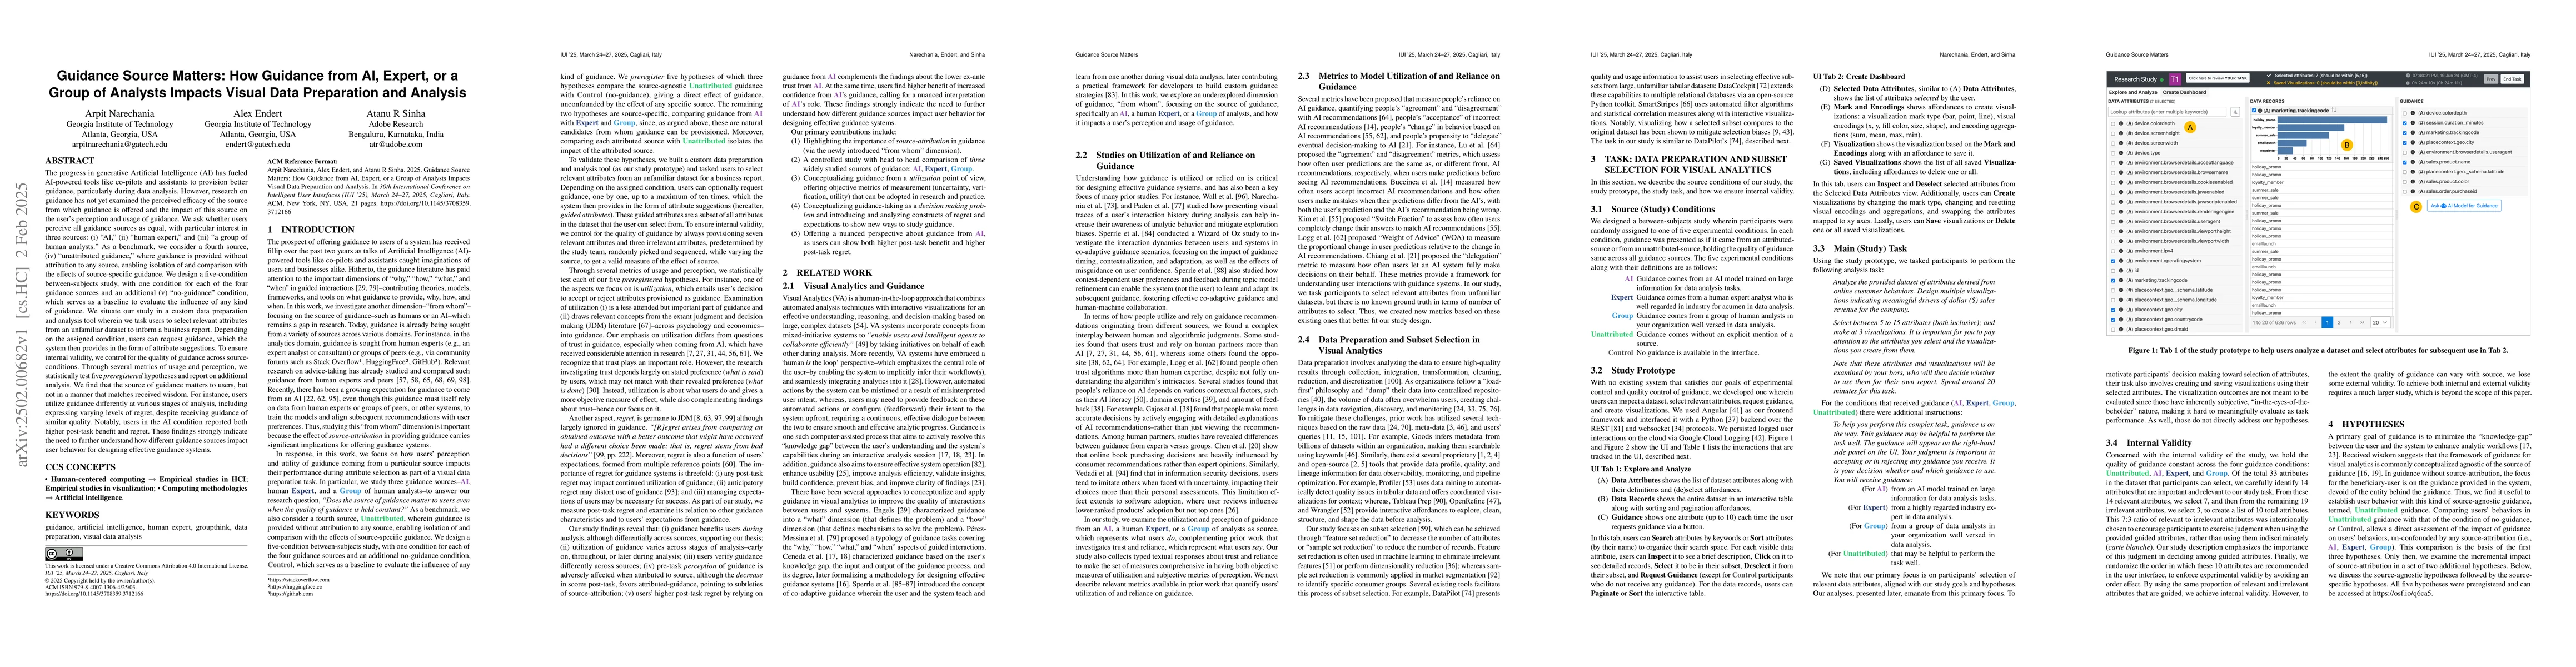
The progress in generative AI has fueled AI-powered tools like co-pilots and assistants to provision better guidance, particularly during data analysis. However, research on guidance has not yet exami...
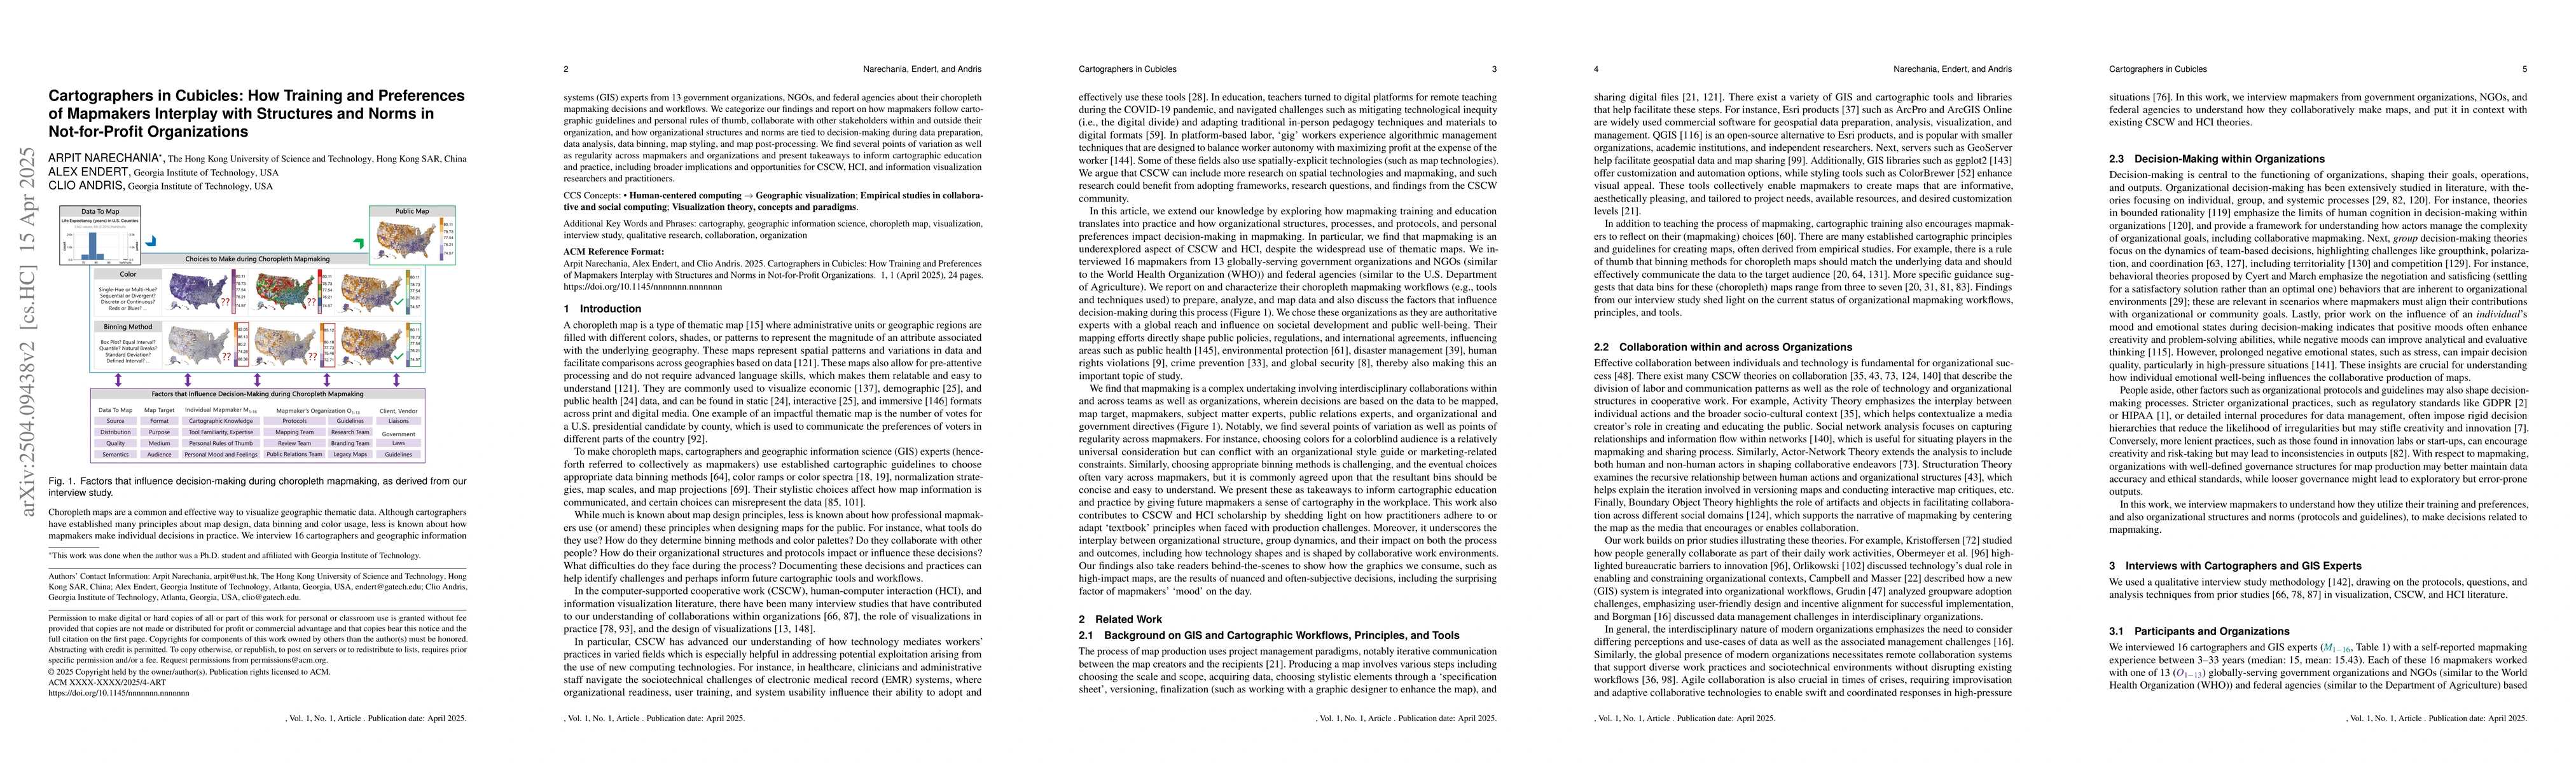
Choropleth maps are a common and effective way to visualize geographic thematic data. Although cartographers have established many principles about map design, data binning and color usage, less is kn...
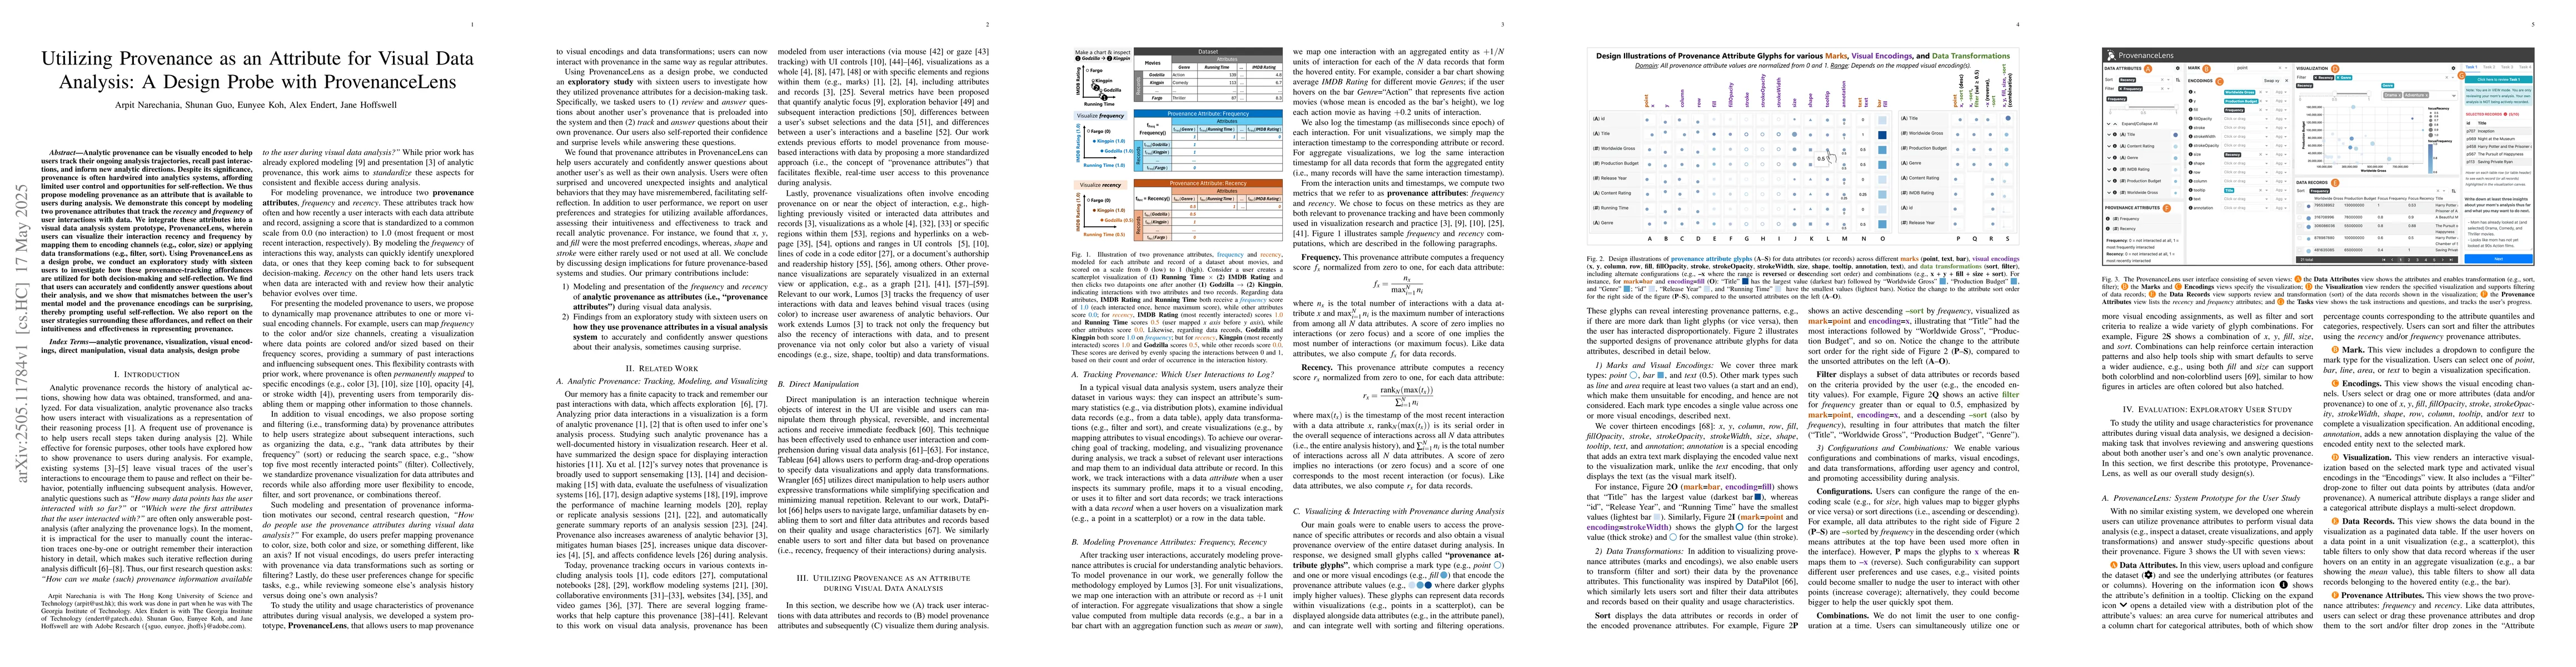
Analytic provenance can be visually encoded to help users track their ongoing analysis trajectories, recall past interactions, and inform new analytic directions. Despite its significance, provenance ...
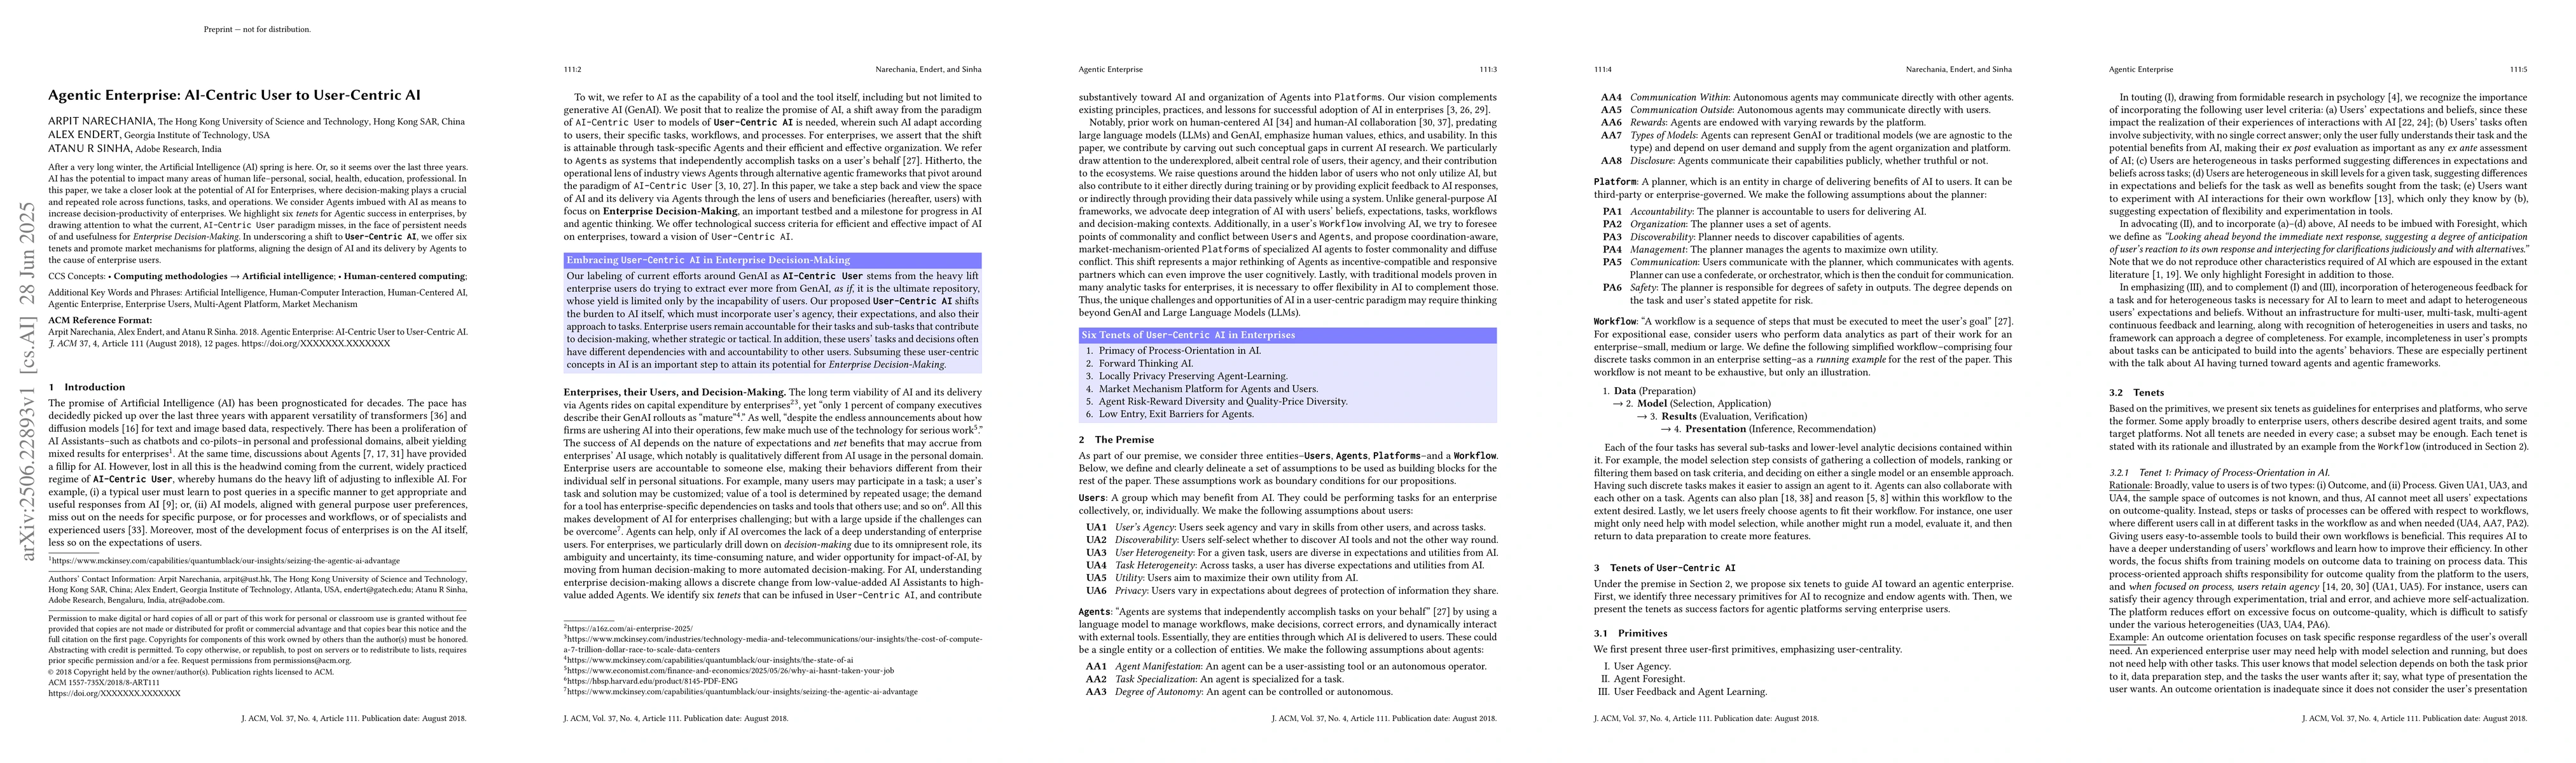
After a very long winter, the Artificial Intelligence (AI) spring is here. Or, so it seems over the last three years. AI has the potential to impact many areas of human life - personal, social, health...
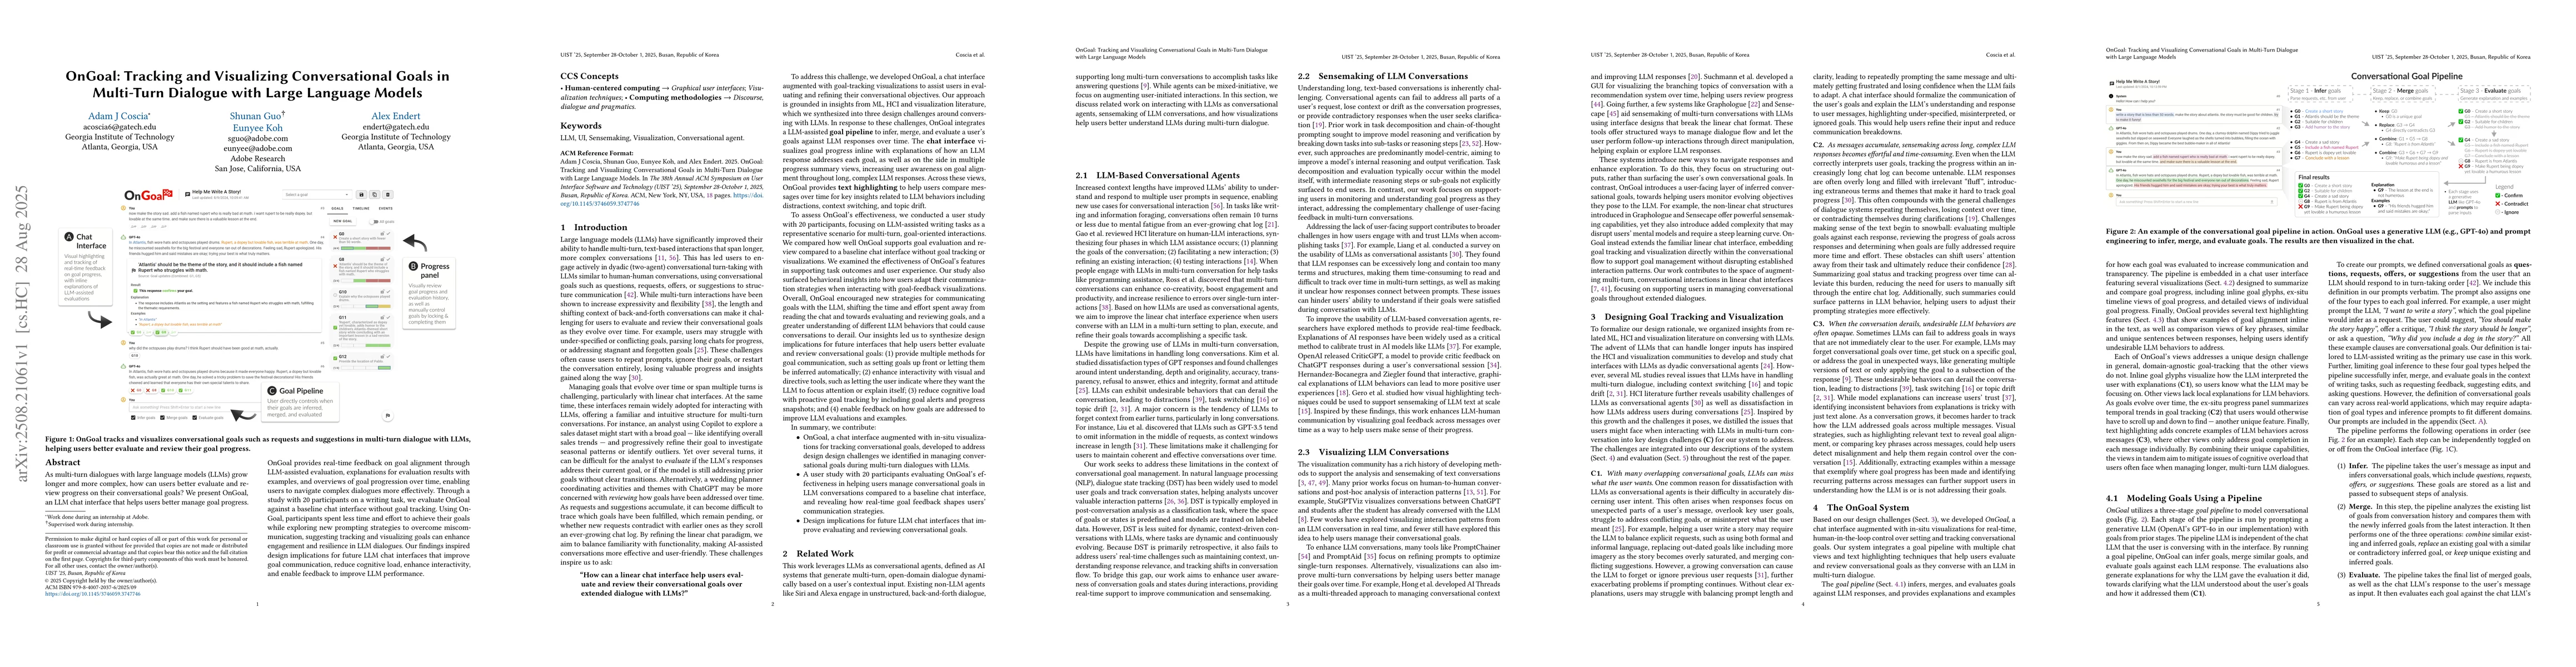
As multi-turn dialogues with large language models (LLMs) grow longer and more complex, how can users better evaluate and review progress on their conversational goals? We present OnGoal, an LLM chat ...
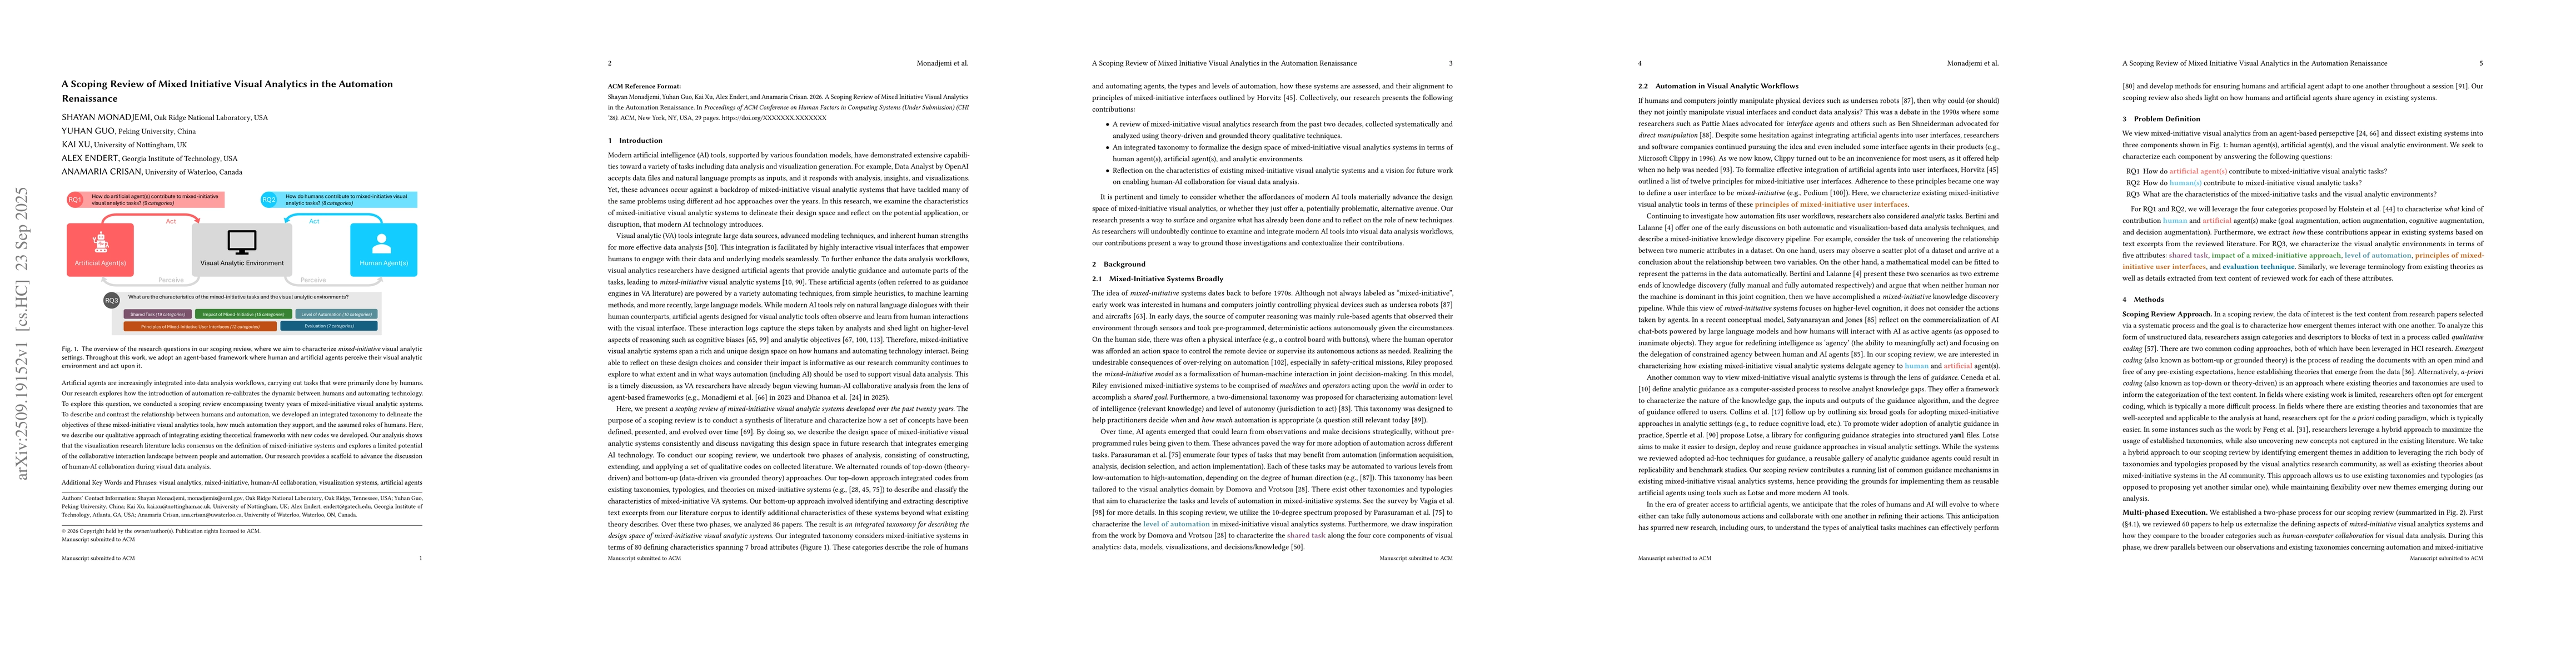
Artificial agents are increasingly integrated into data analysis workflows, carrying out tasks that were primarily done by humans. Our research explores how the introduction of automation re-calibrate...
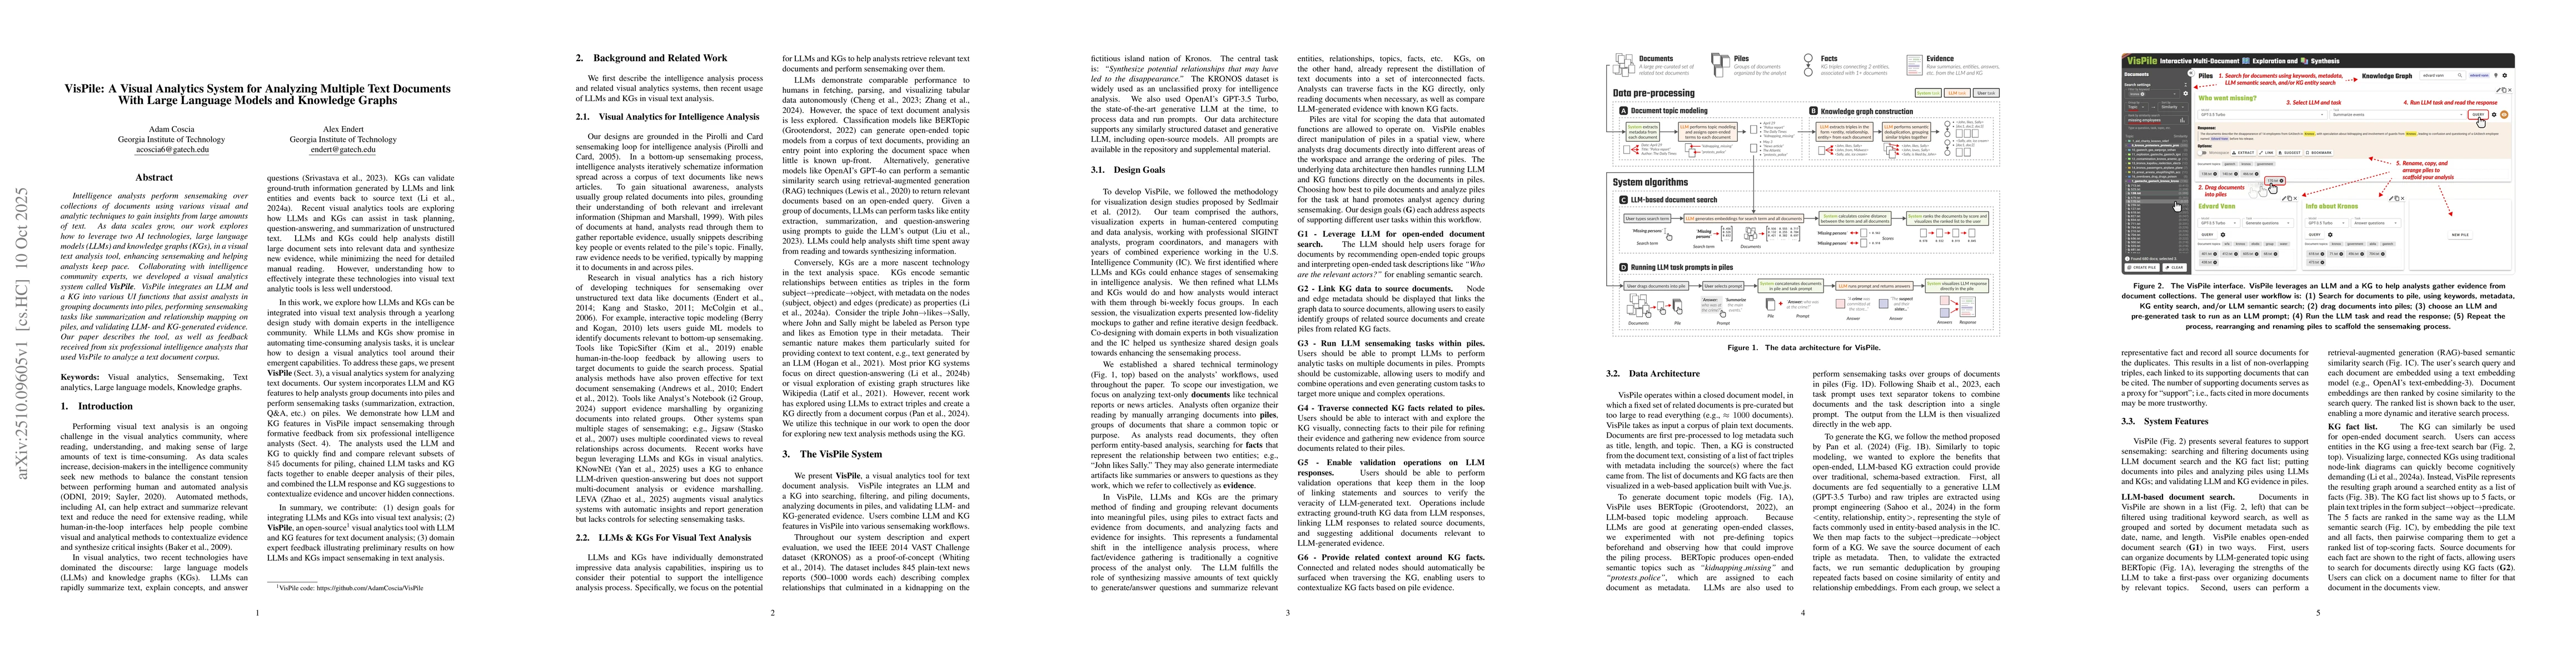
Intelligence analysts perform sensemaking over collections of documents using various visual and analytic techniques to gain insights from large amounts of text. As data scales grow, our work explores...

When creating choropleth maps, mapmakers often bin (i.e., group, classify) quantitative data values into groups to help show that certain areas fall within a similar range of values. For instance, a m...
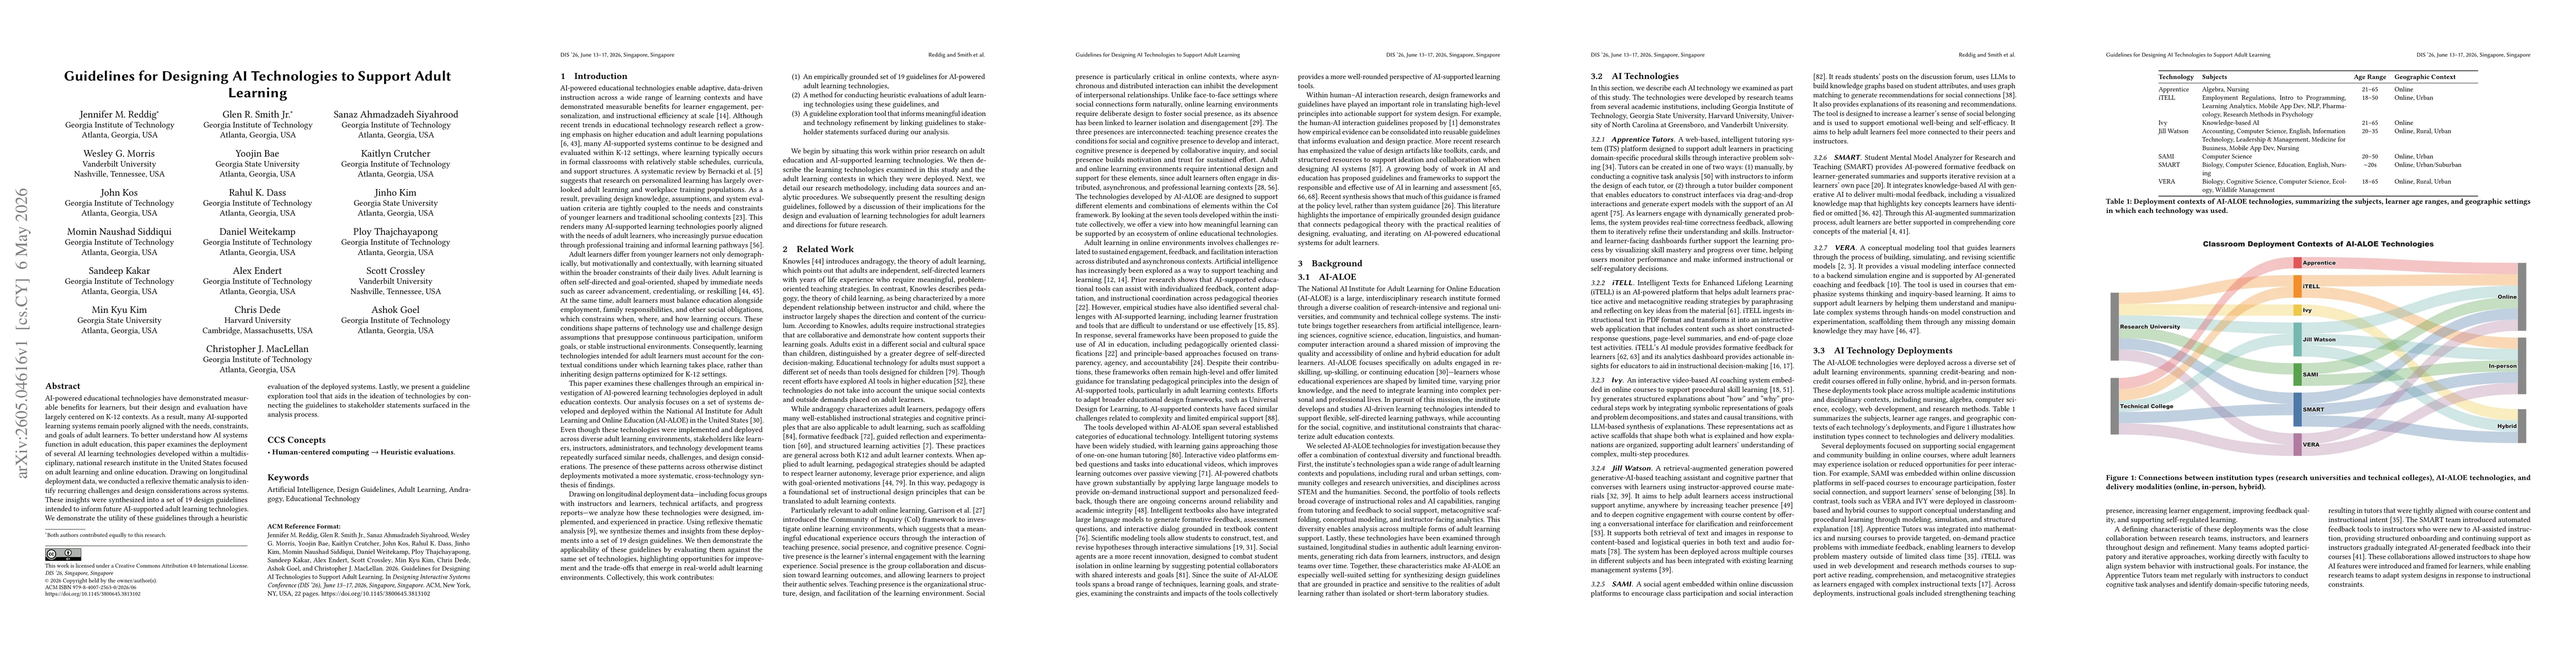
AI-powered educational technologies have demonstrated measurable benefits for learners, but their design and evaluation have largely centered on K-12 contexts. As a result, many AI-supported learning ...