Publication
Metrics
AI Quick Summary
This paper presents a design elicitation study to understand user preferences for data relationship visualizations, resulting in a user-defined categorization of visualization augmentations and insights into participant design considerations, alongside a repository of participant-drawn augmentations.
Paper Preview
Abstract
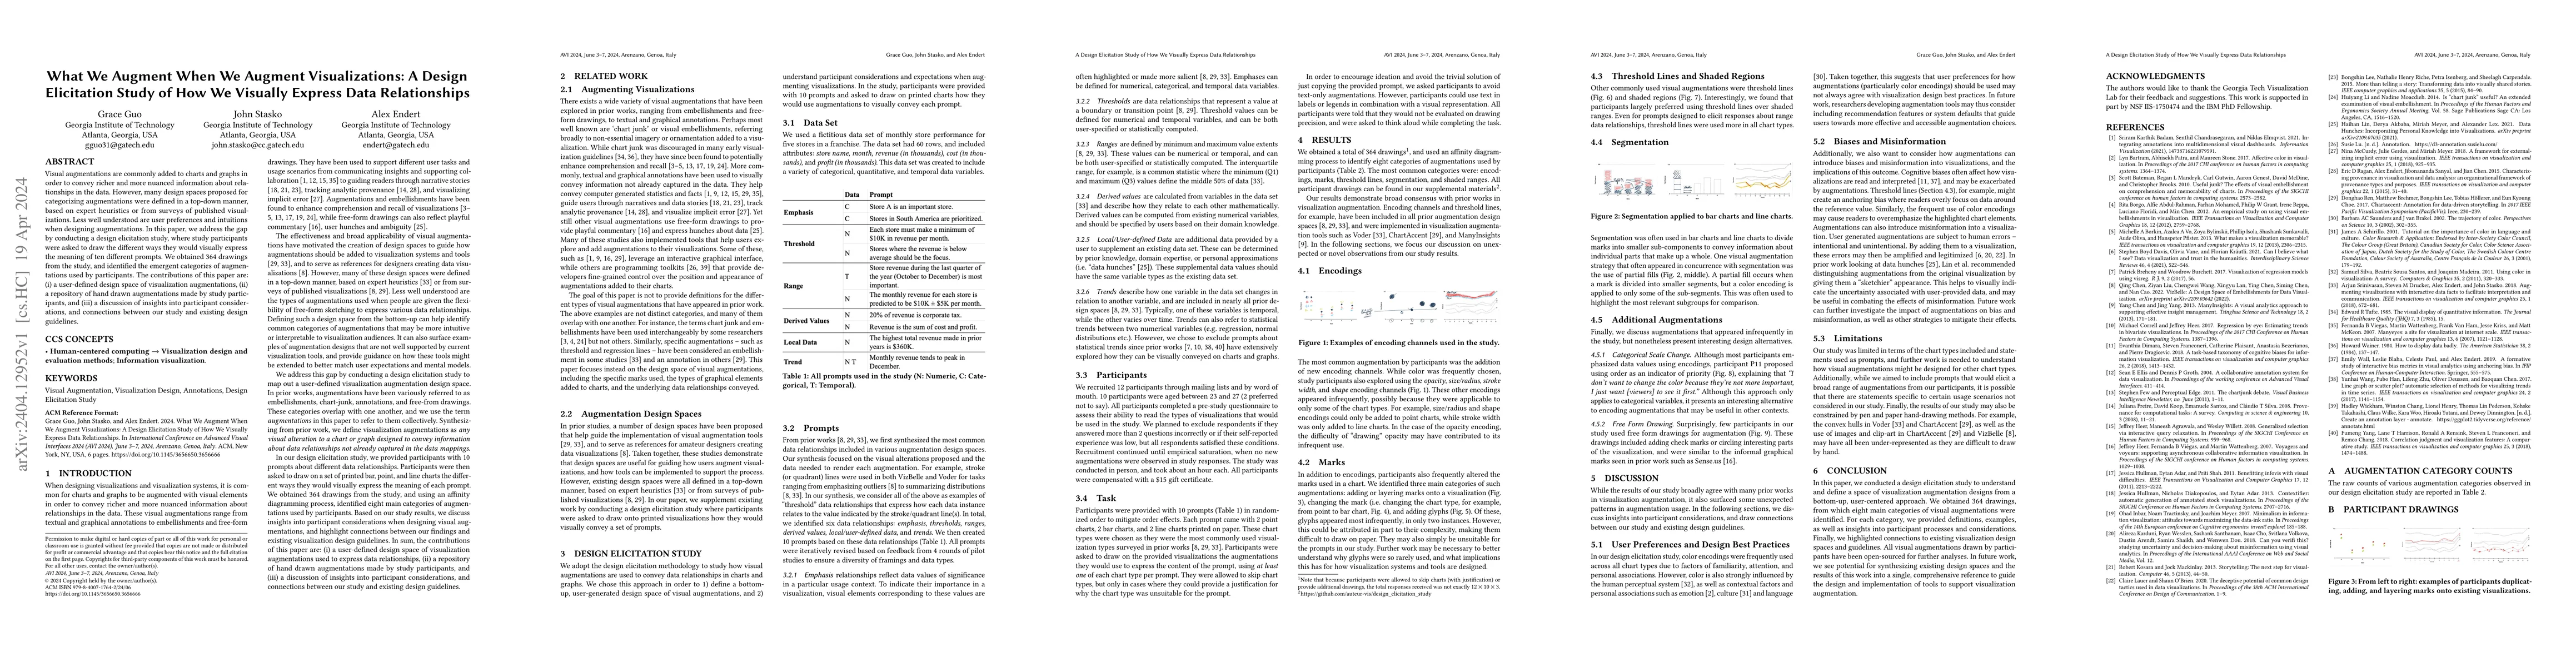
Visual augmentations are commonly added to charts and graphs in order to convey richer and more nuanced information about relationships in the data. However, many design spaces proposed for categorizing augmentations were defined in a top-down manner, based on expert heuristics or from surveys of published visualizations. Less well understood are user preferences and intuitions when designing augmentations. In this paper, we address the gap by conducting a design elicitation study, where study participants were asked to draw the different ways they would visually express the meaning of ten different prompts. We obtained 364 drawings from the study, and identified the emergent categories of augmentations used by participants. The contributions of this paper are: (i) a user-defined design space of visualization augmentations, (ii) a repository of hand drawn augmentations made by study participants, and (iii) a discussion of insights into participant considerations, and connections between our study and existing design guidelines.
AI Key Findings
Get AI-generated insights about this paper's methodology, results, significance, and more — seven facets brought into focus.
Impact
Paper Details
Authors
PDF Preview
Key Terms
Citation Network
Current paper (gray), citations (green), references (blue)
Display is limited for performance on very large graphs.
Discussion 0