Academic Profile
Statistics
Similar Authors
Papers on arXiv
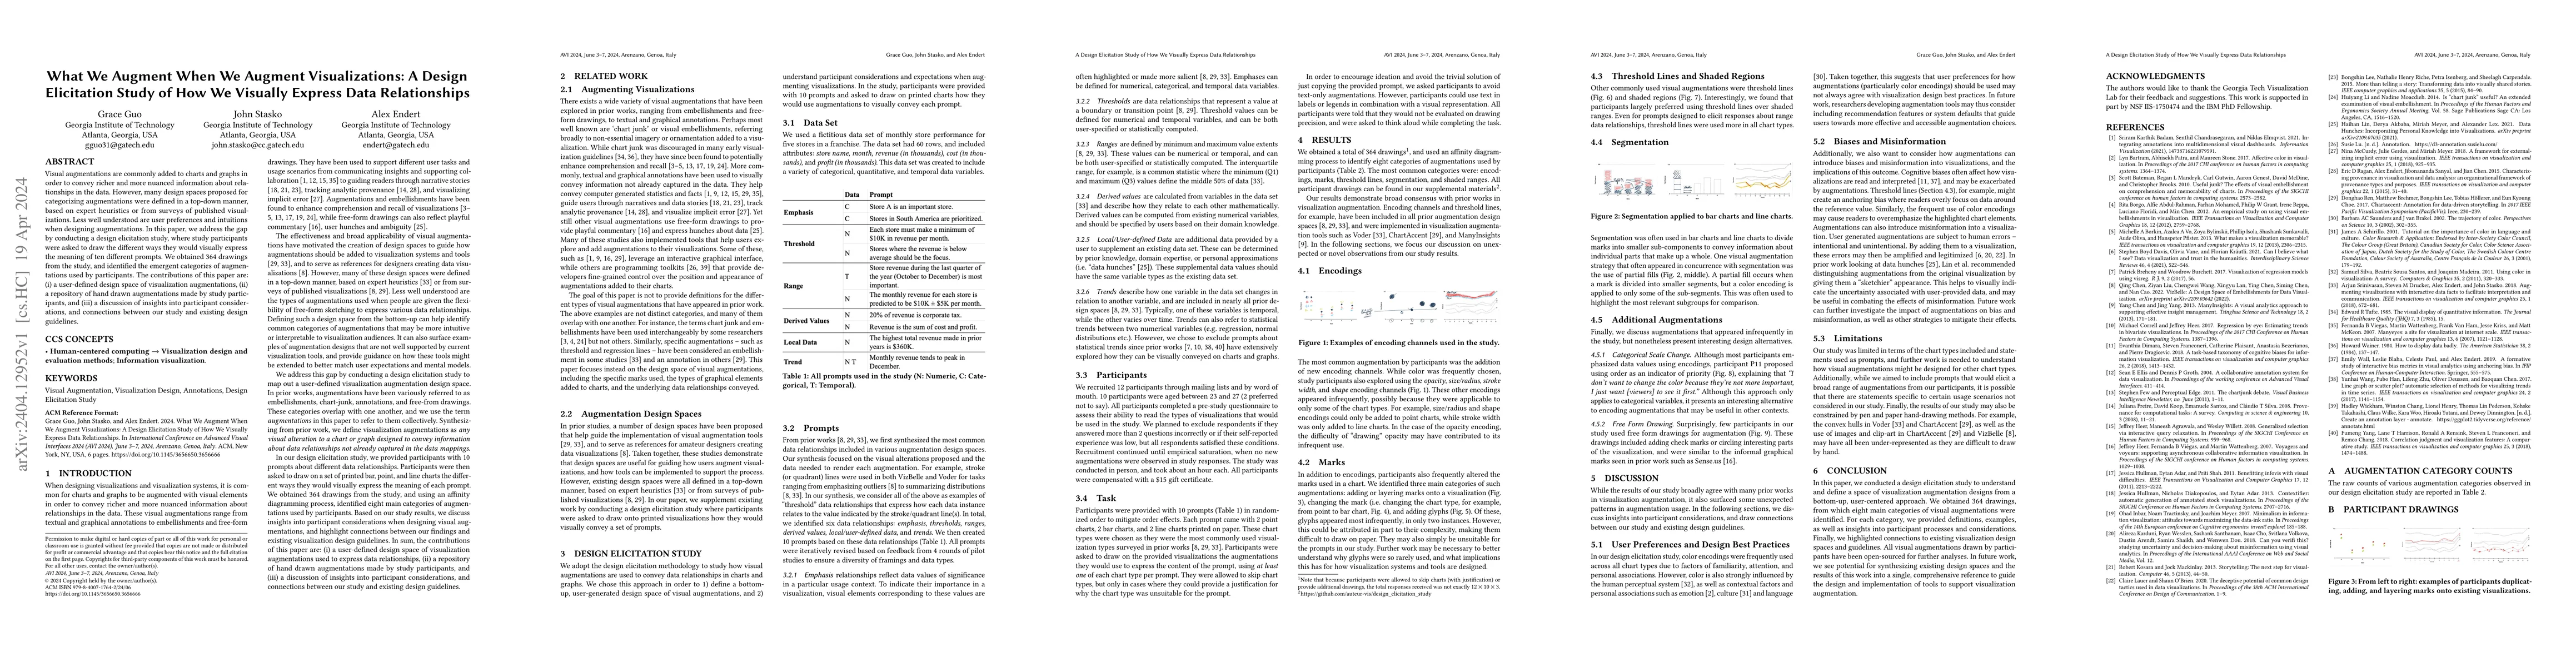
Visual augmentations are commonly added to charts and graphs in order to convey richer and more nuanced information about relationships in the data. However, many design spaces proposed for categori...
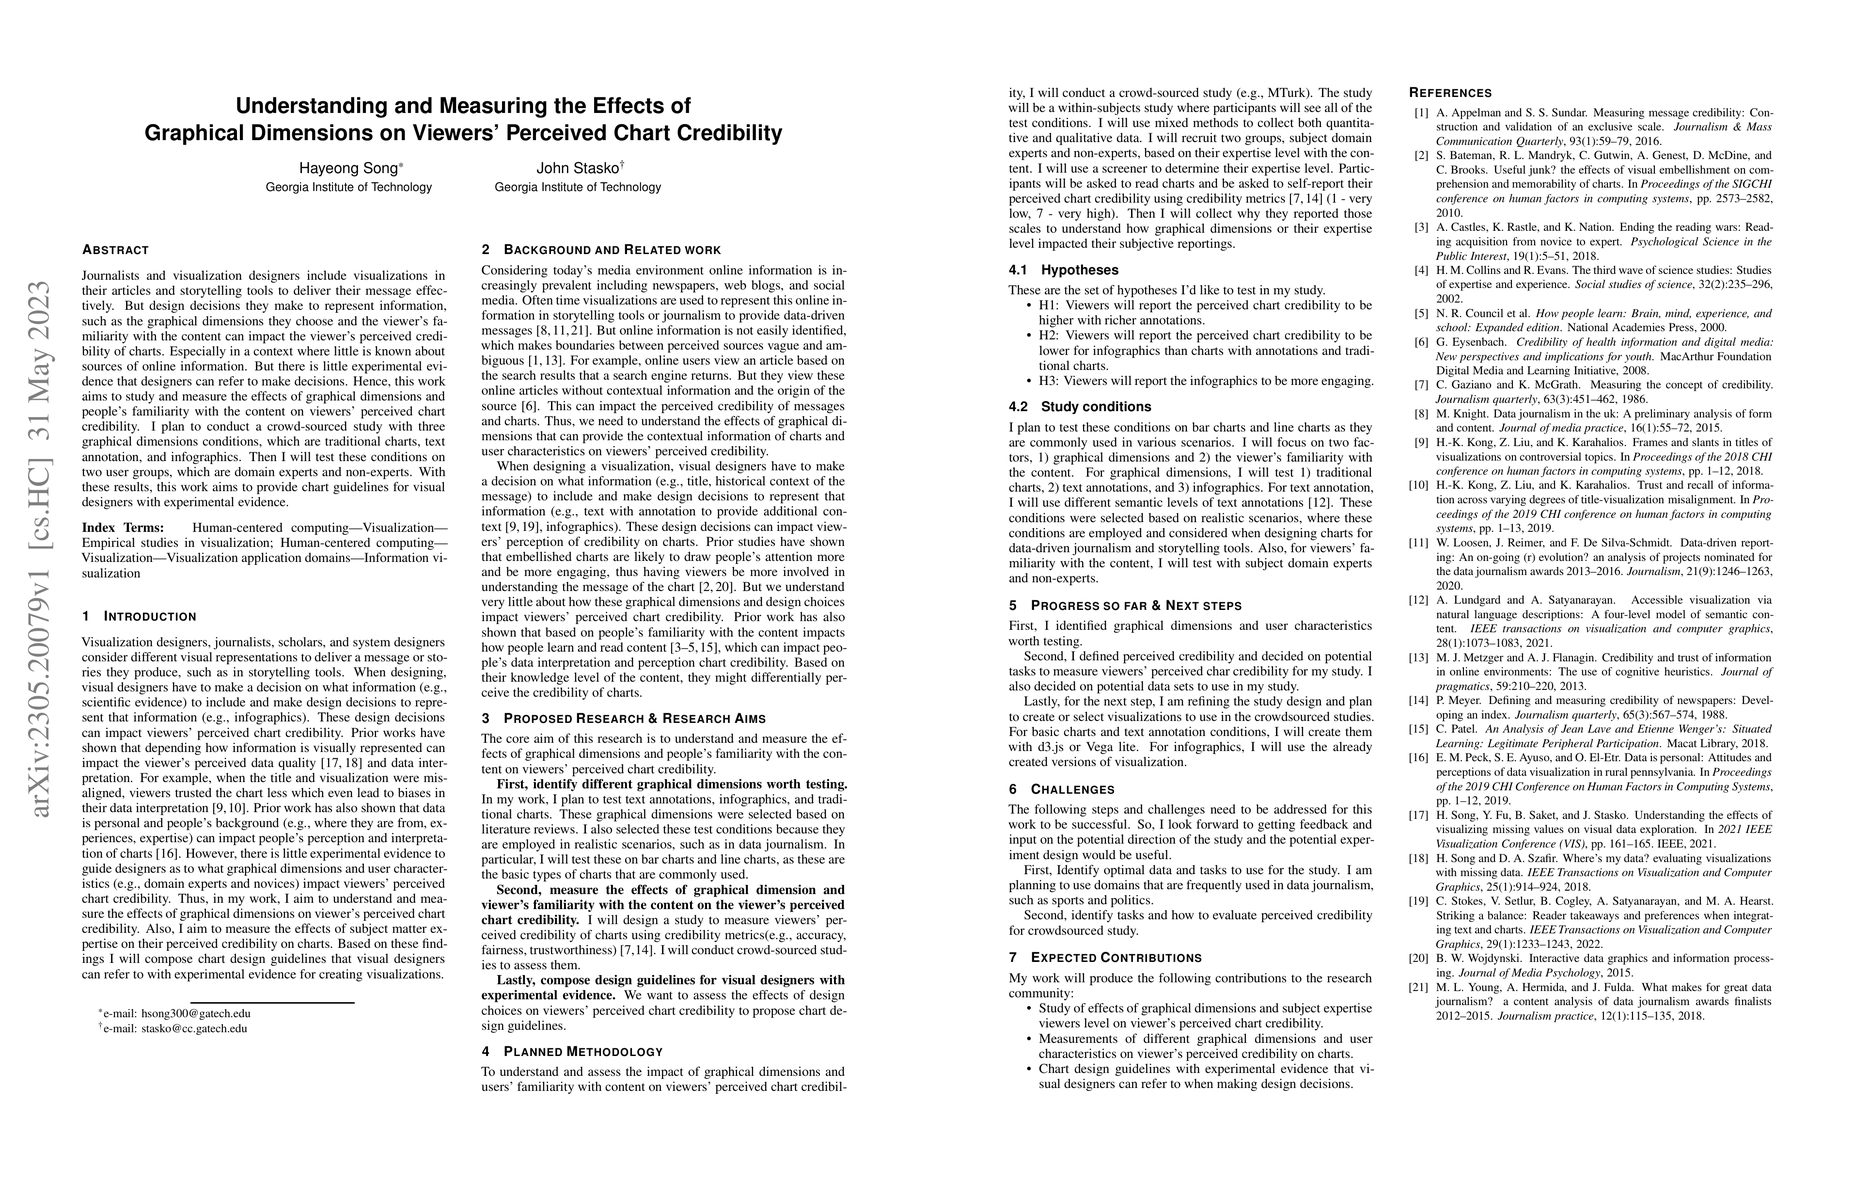
Journalists and visualization designers include visualizations in their articles and storytelling tools to deliver their message effectively. But design decisions they make to represent information,...
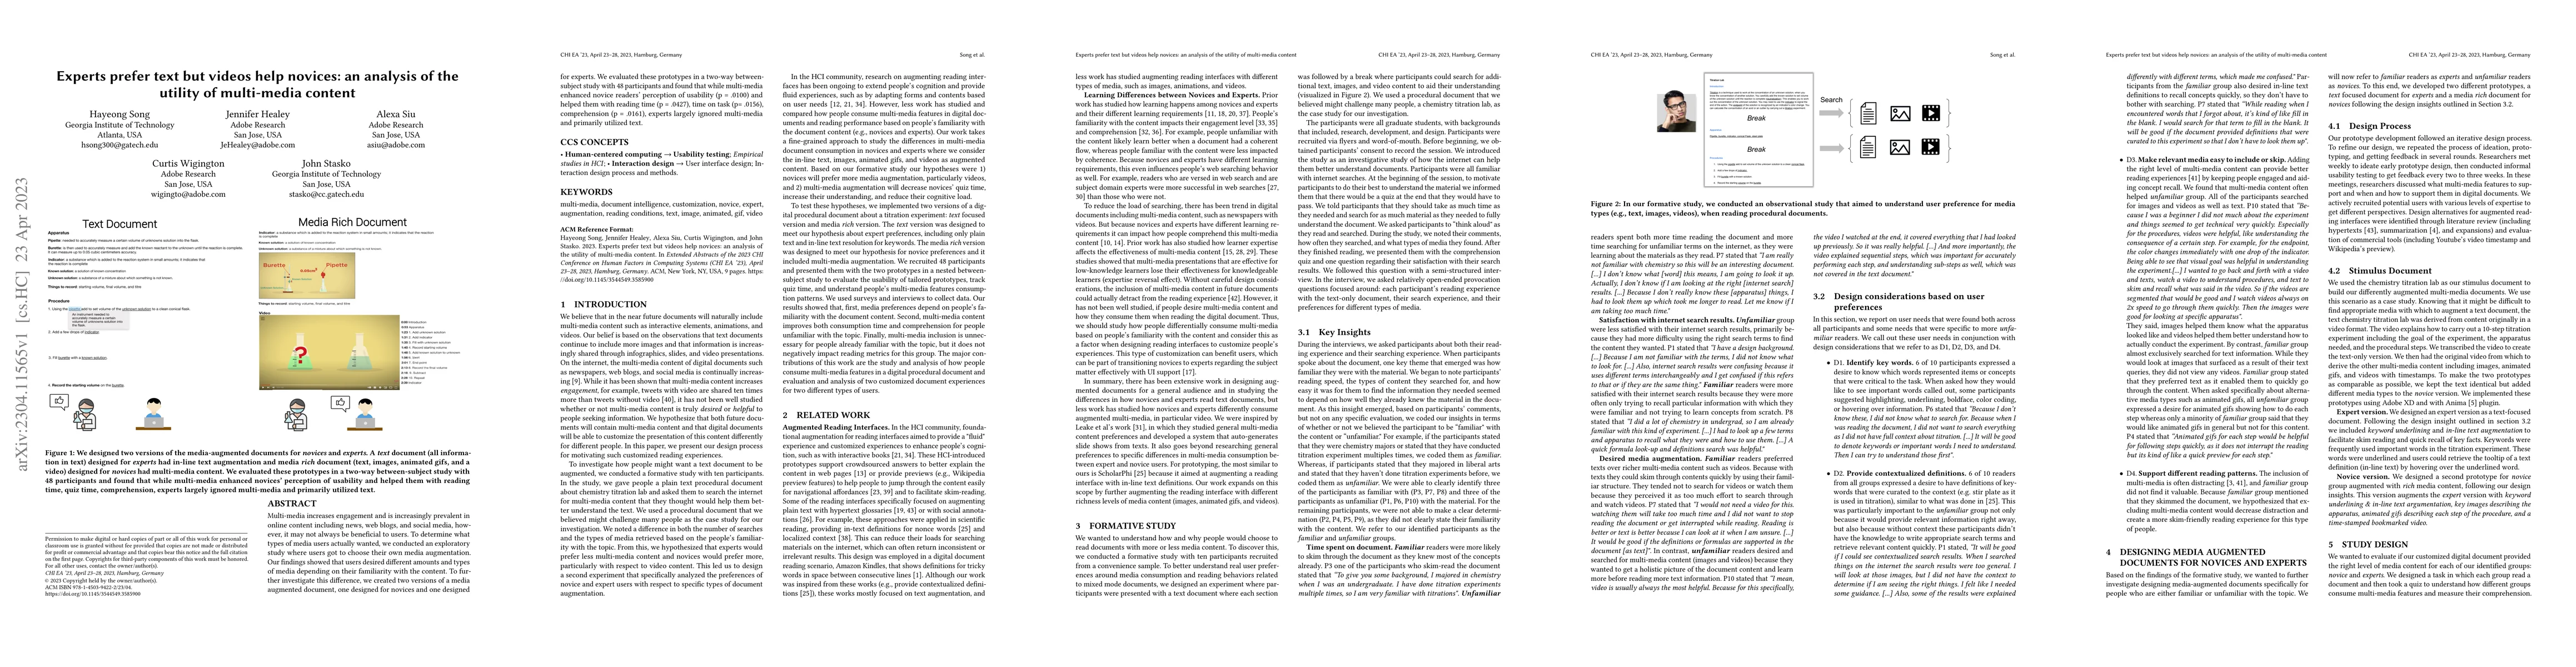
Multi-media increases engagement and is increasingly prevalent in online content including news, web blogs, and social media, however, it may not always be beneficial to users. To determine what typ...
Social media (i.e., Reddit) users are overloaded with people's opinions when viewing discourses about divisive topics. Traditional user interfaces in such media present those opinions in a linear st...
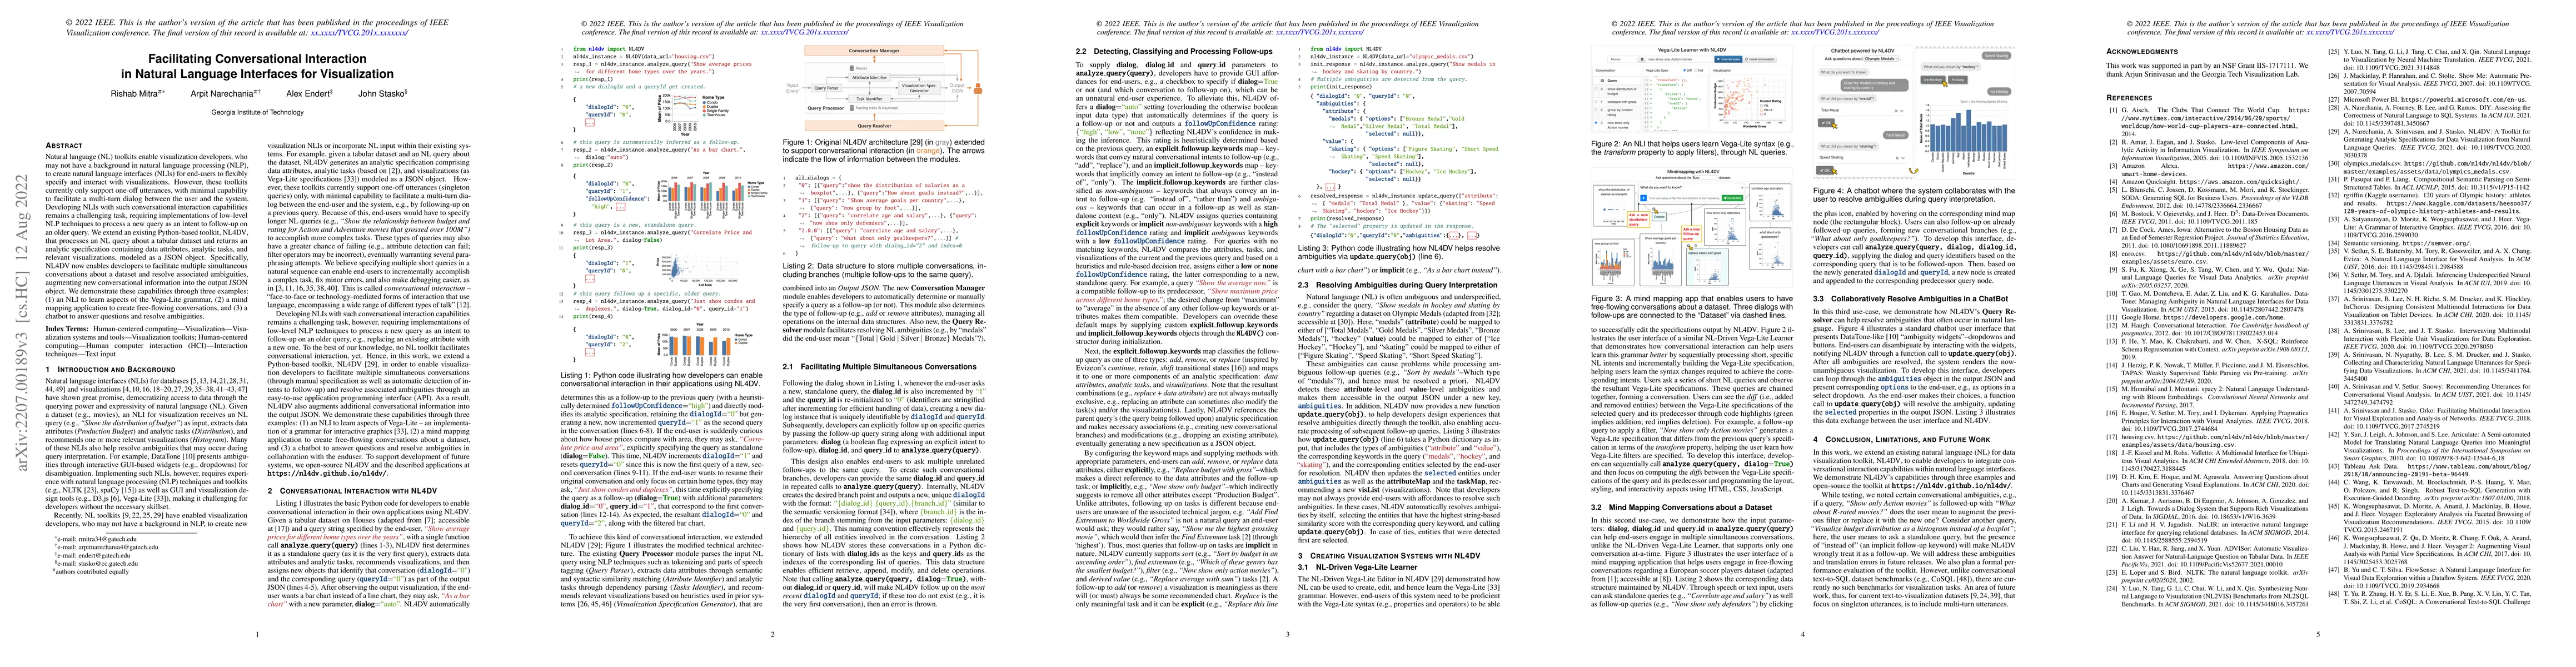
Natural language (NL) toolkits enable visualization developers, who may not have a background in natural language processing (NLP), to create natural language interfaces (NLIs) for end-users to flex...
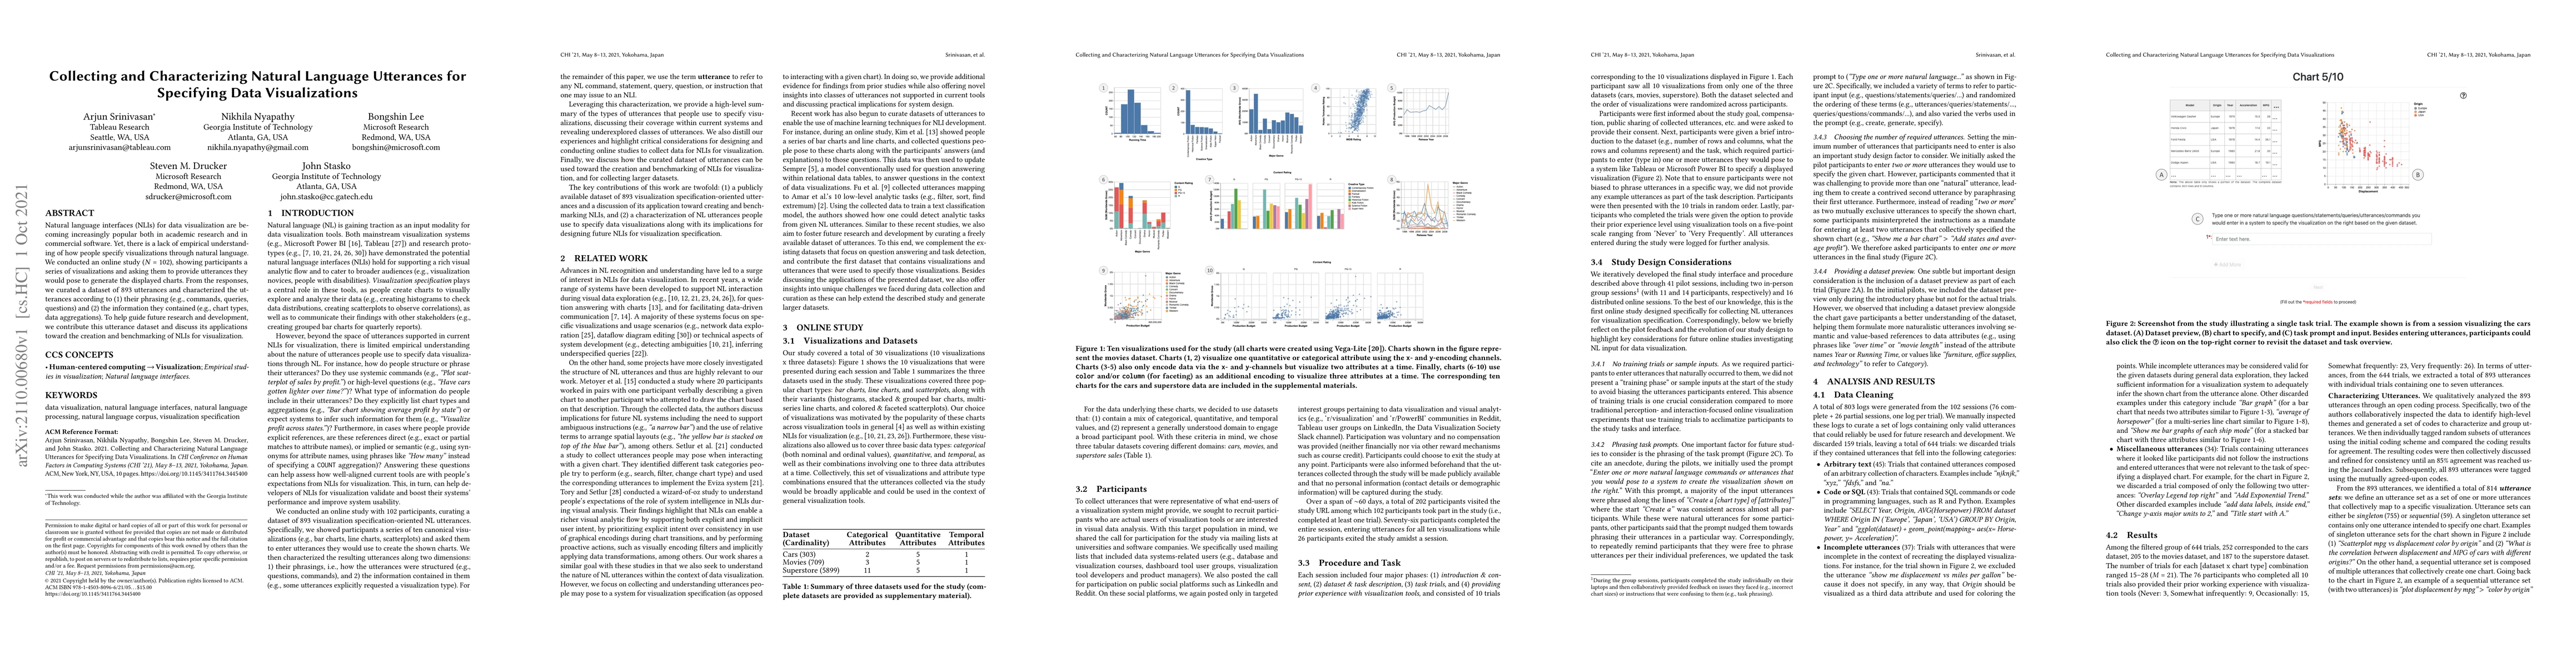
Natural language interfaces (NLIs) for data visualization are becoming increasingly popular both in academic research and in commercial software. Yet, there is a lack of empirical understanding of h...

When performing data analysis, people often confront data sets containing missing values. We conducted an empirical study to understand the effects of visualizing those missing values on participant...
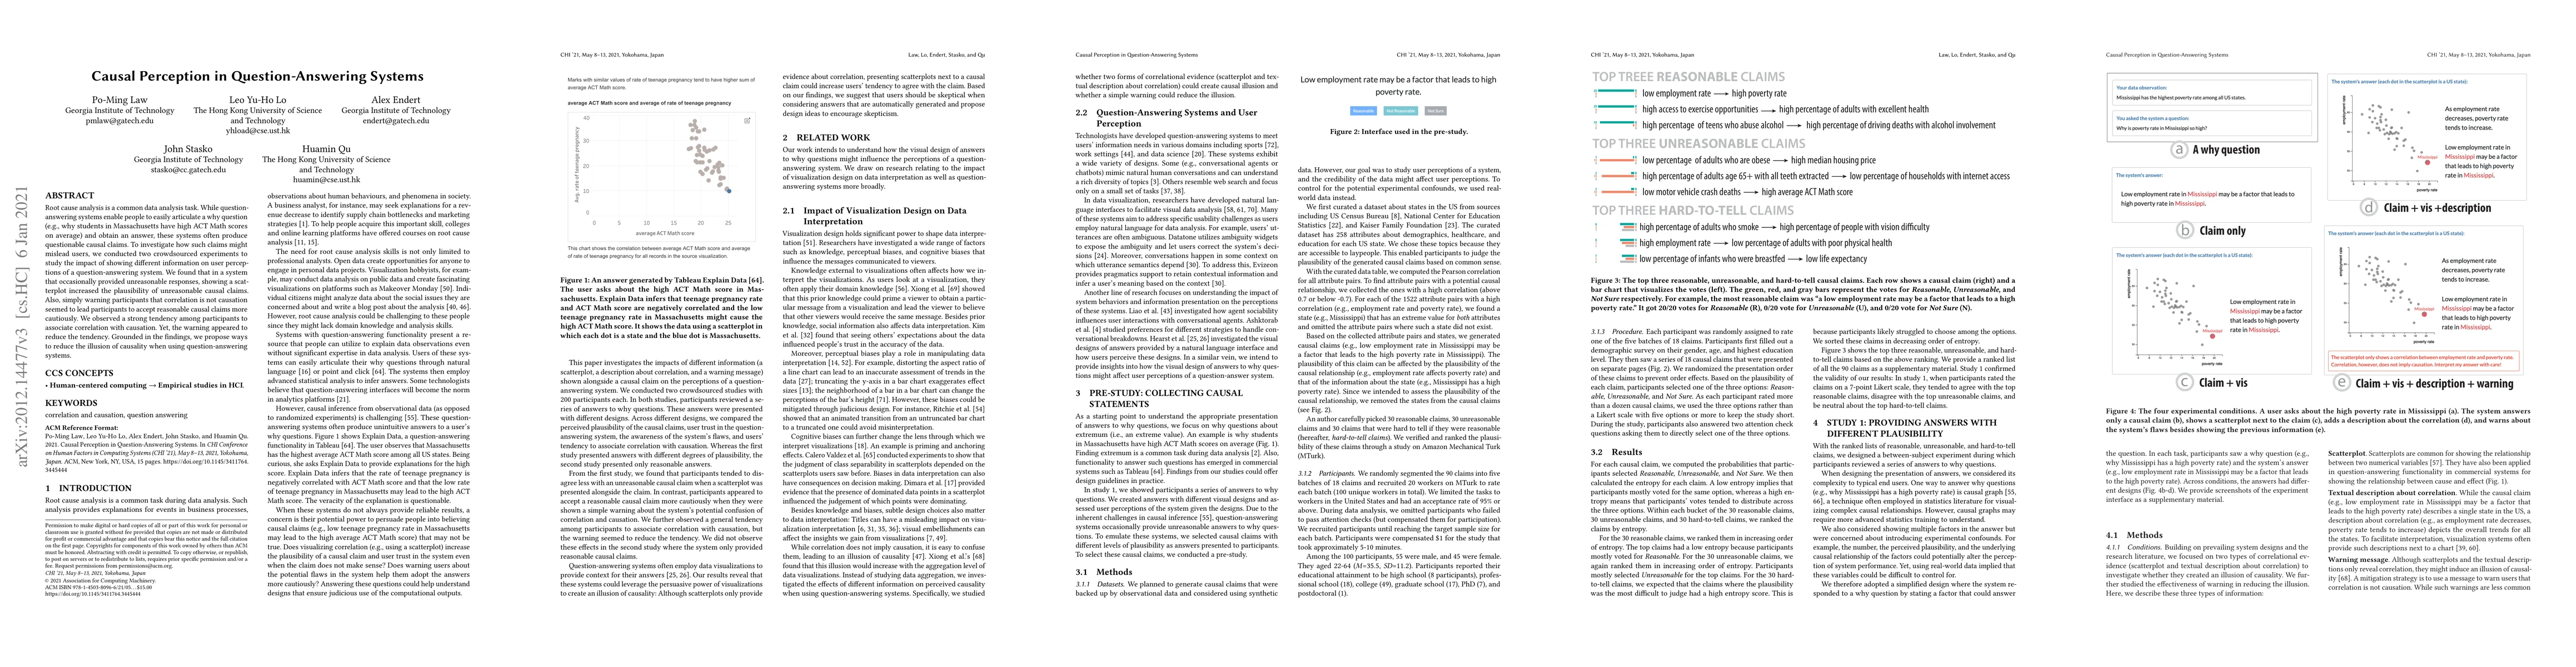
Root cause analysis is a common data analysis task. While question-answering systems enable people to easily articulate a why question (e.g., why students in Massachusetts have high ACT Math scores ...
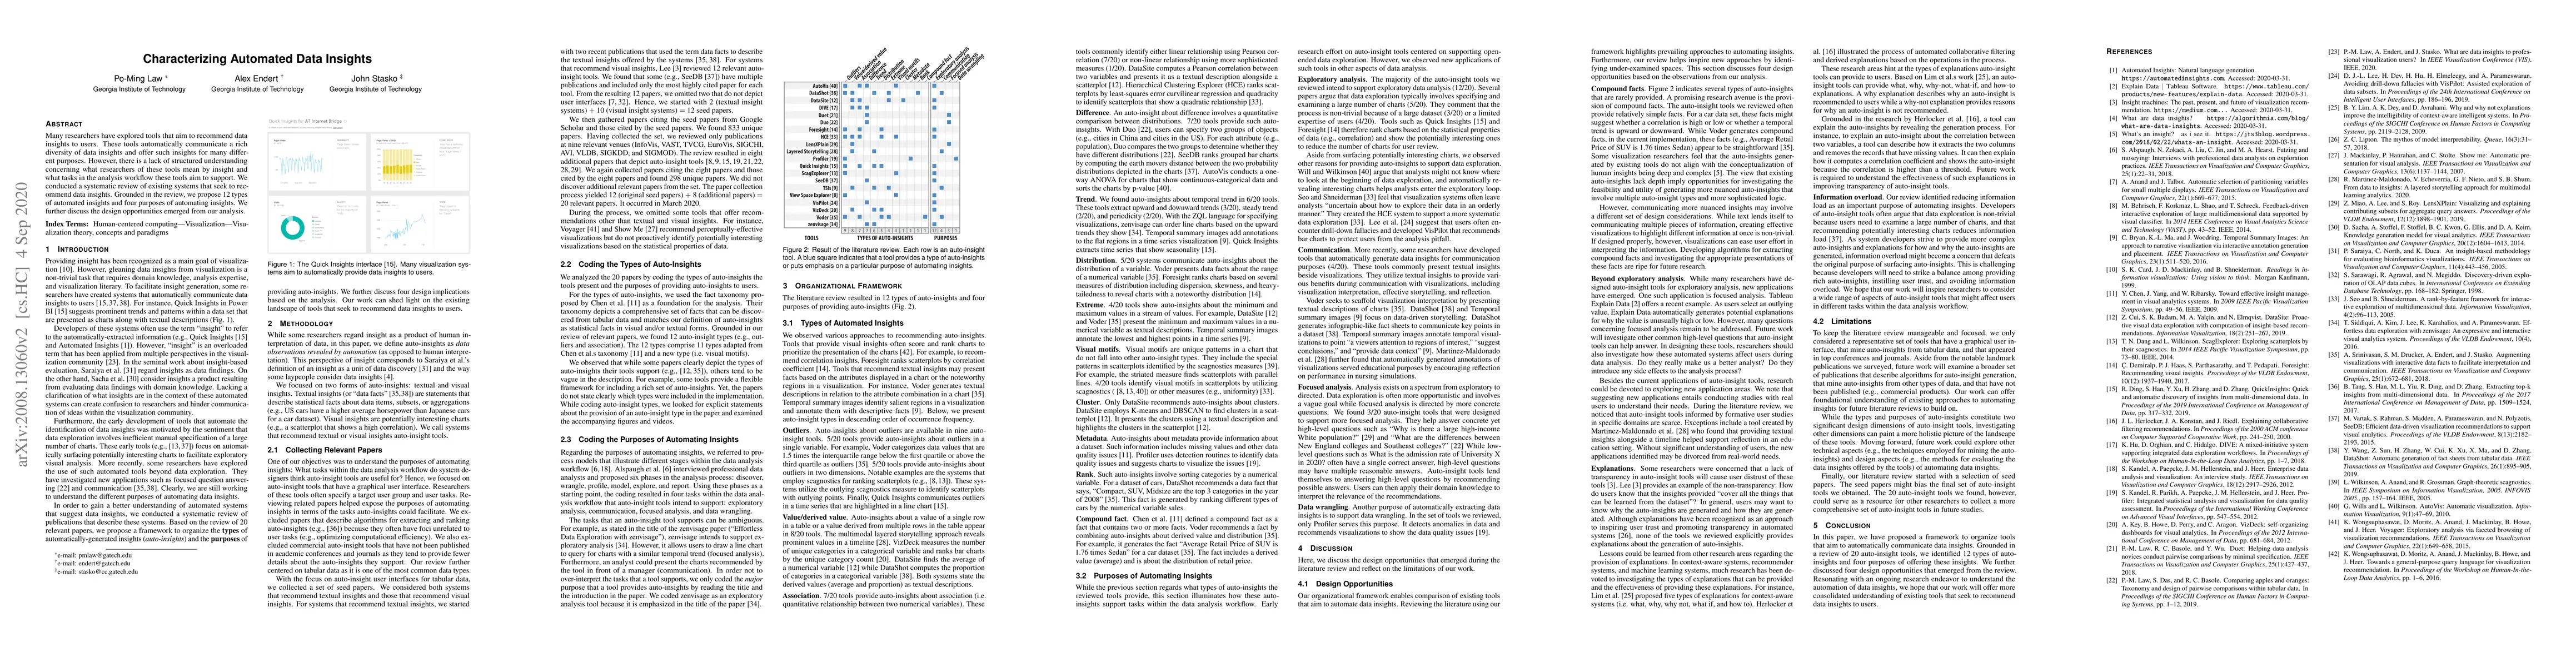
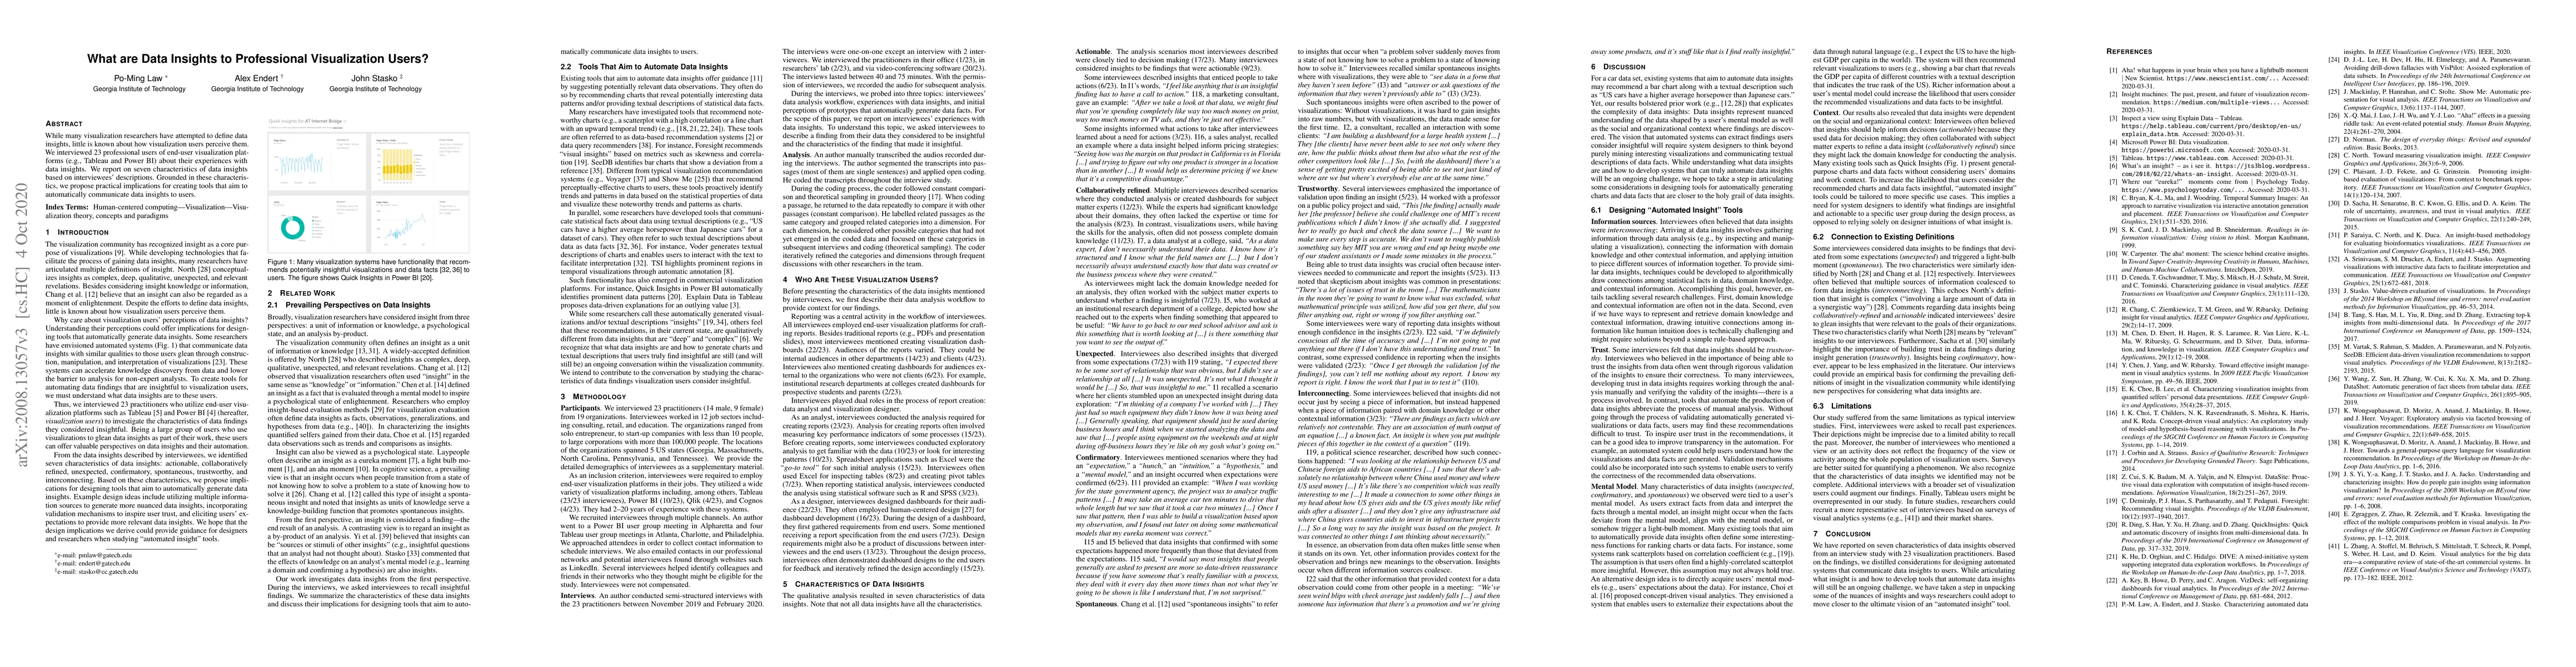
Many researchers have explored tools that aim to recommend data insights to users. These tools automatically communicate a rich diversity of data insights and offer such insights for many different ...
While many visualization researchers have attempted to define data insights, little is known about how visualization users perceive them. We interviewed 23 professional users of end-user visualizati...
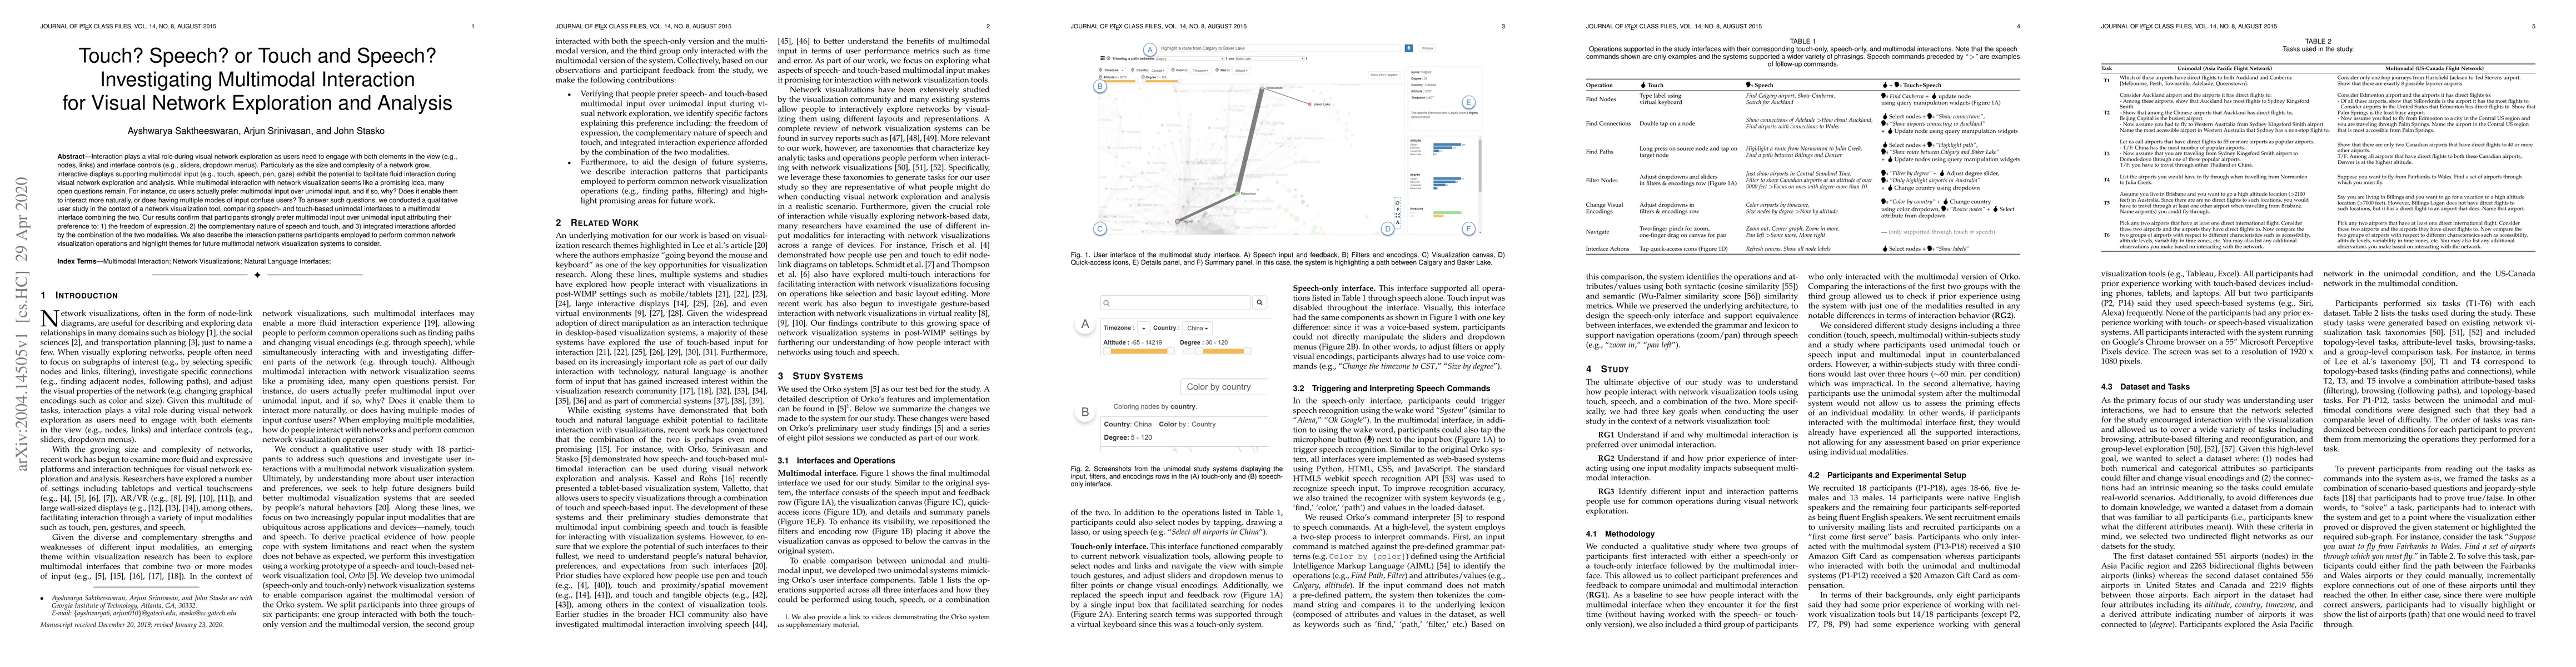
Interaction plays a vital role during visual network exploration as users need to engage with both elements in the view (e.g., nodes, links) and interface controls (e.g., sliders, dropdown menus). P...
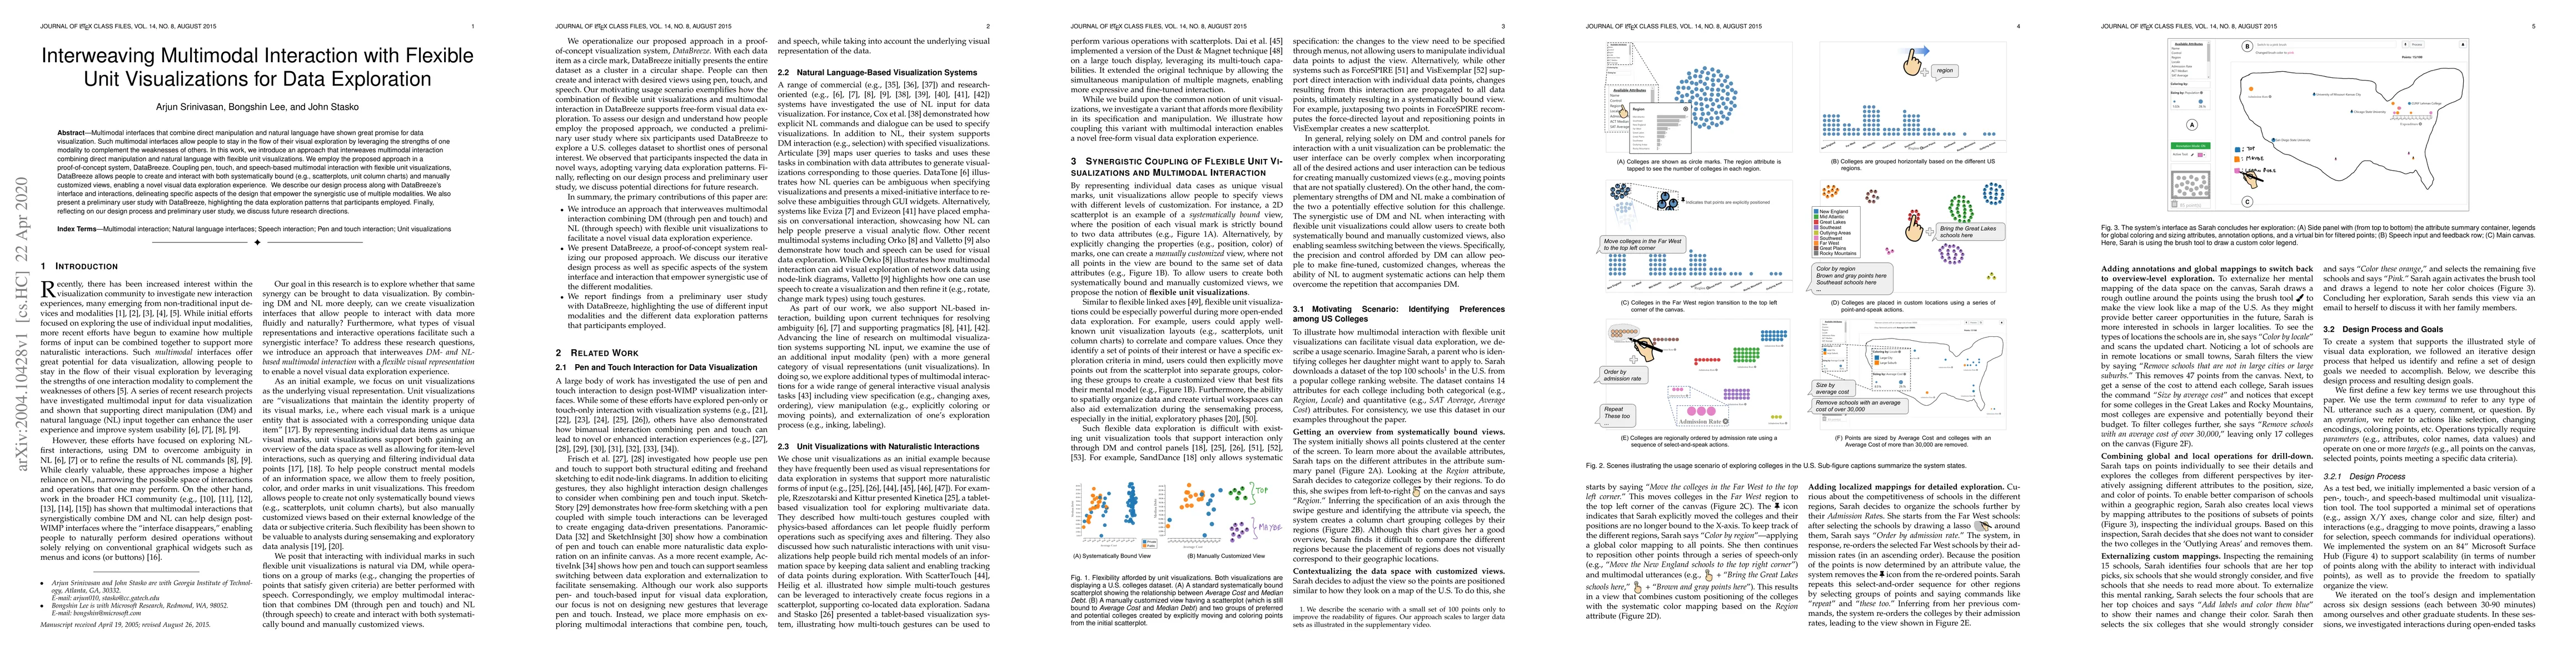
Multimodal interfaces that combine direct manipulation and natural language have shown great promise for data visualization. Such multimodal interfaces allow people to stay in the flow of their visu...
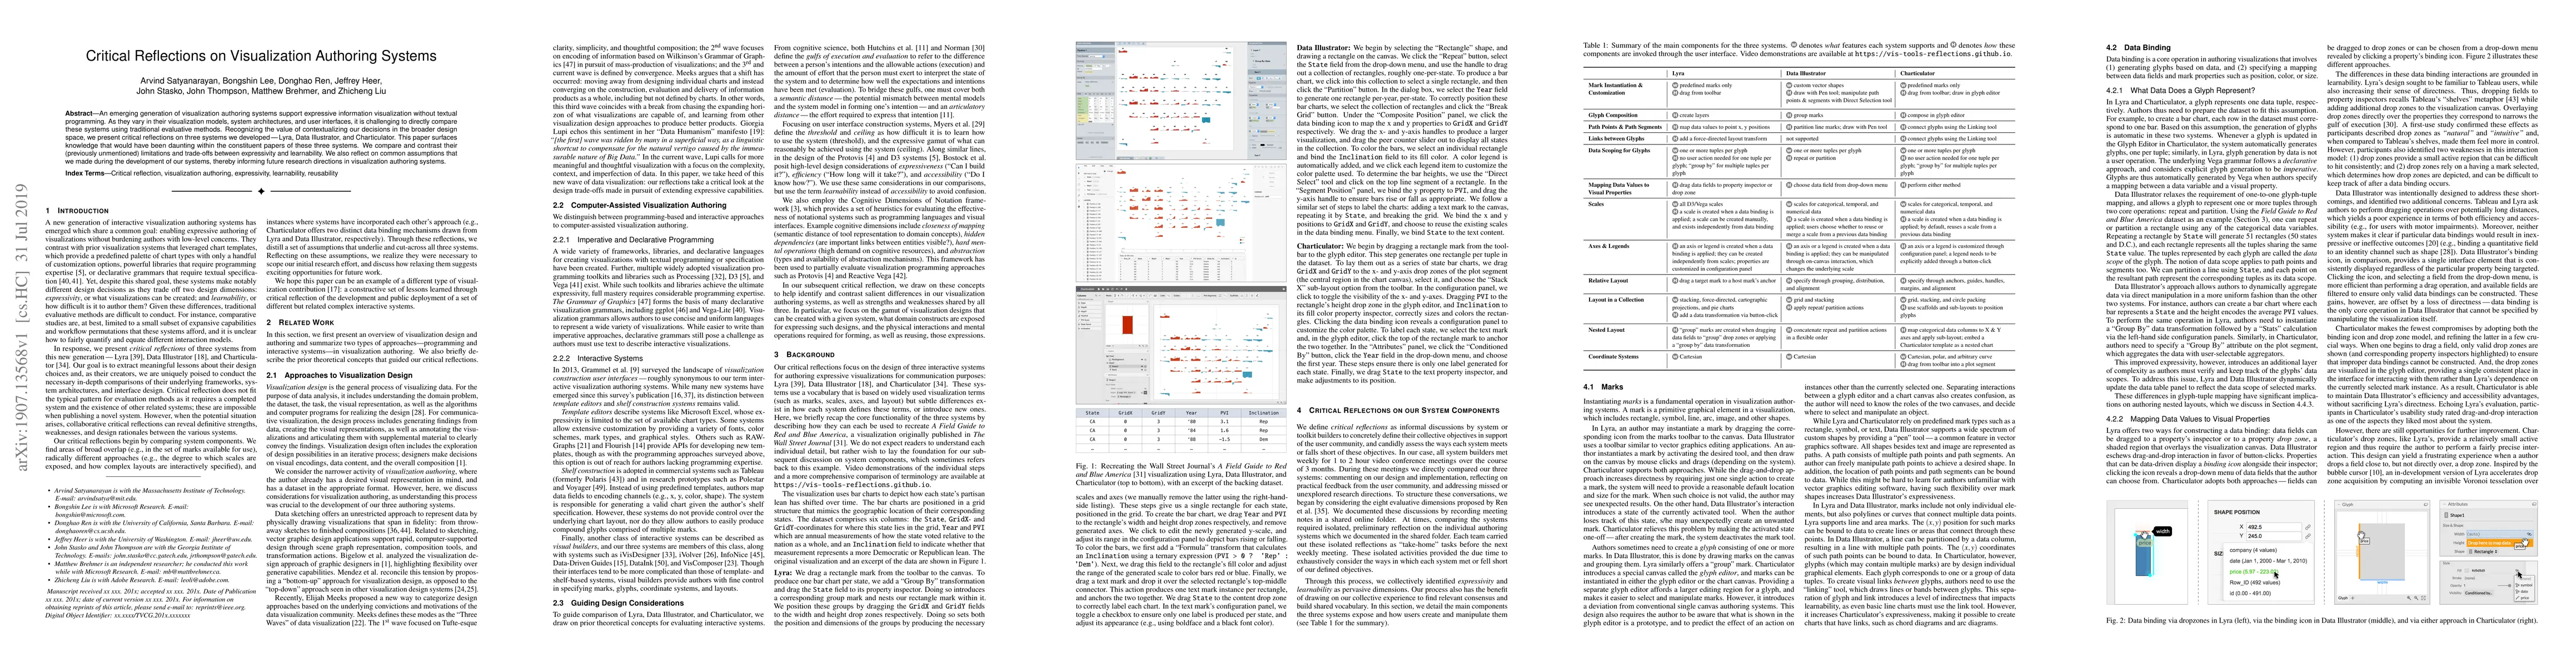
An emerging generation of visualization authoring systems support expressive information visualization without textual programming. As they vary in their visualization models, system architectures, ...
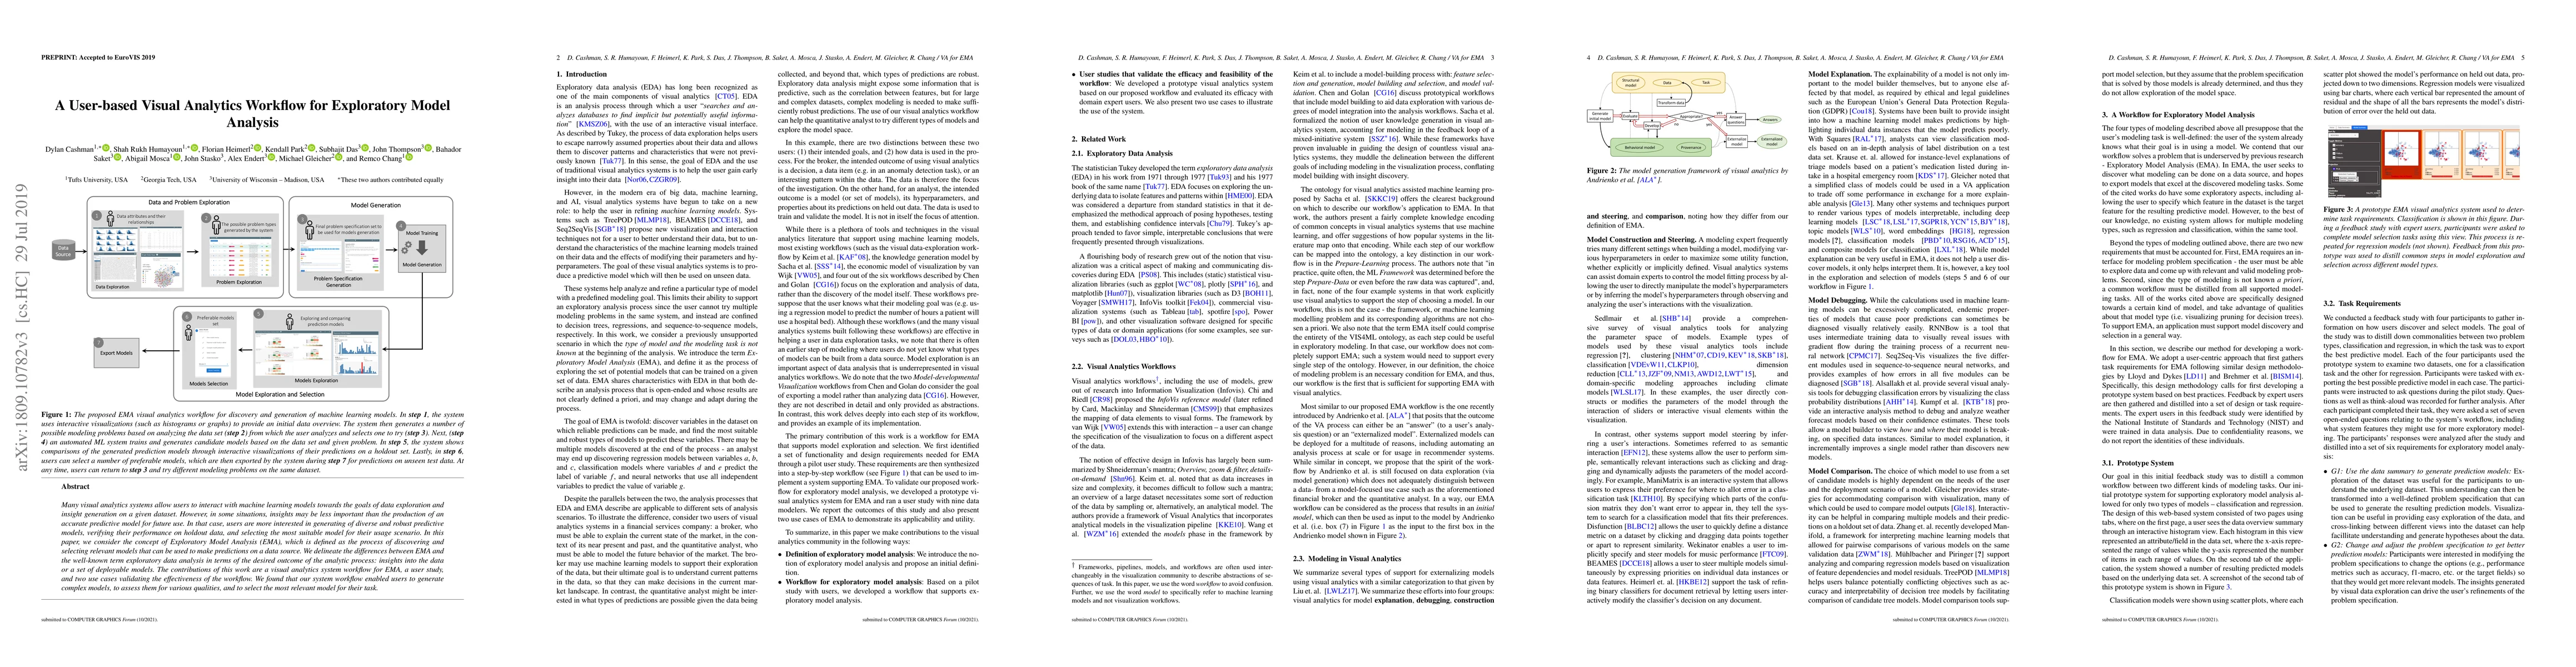
Many visual analytics systems allow users to interact with machine learning models towards the goals of data exploration and insight generation on a given dataset. However, in some situations, insig...
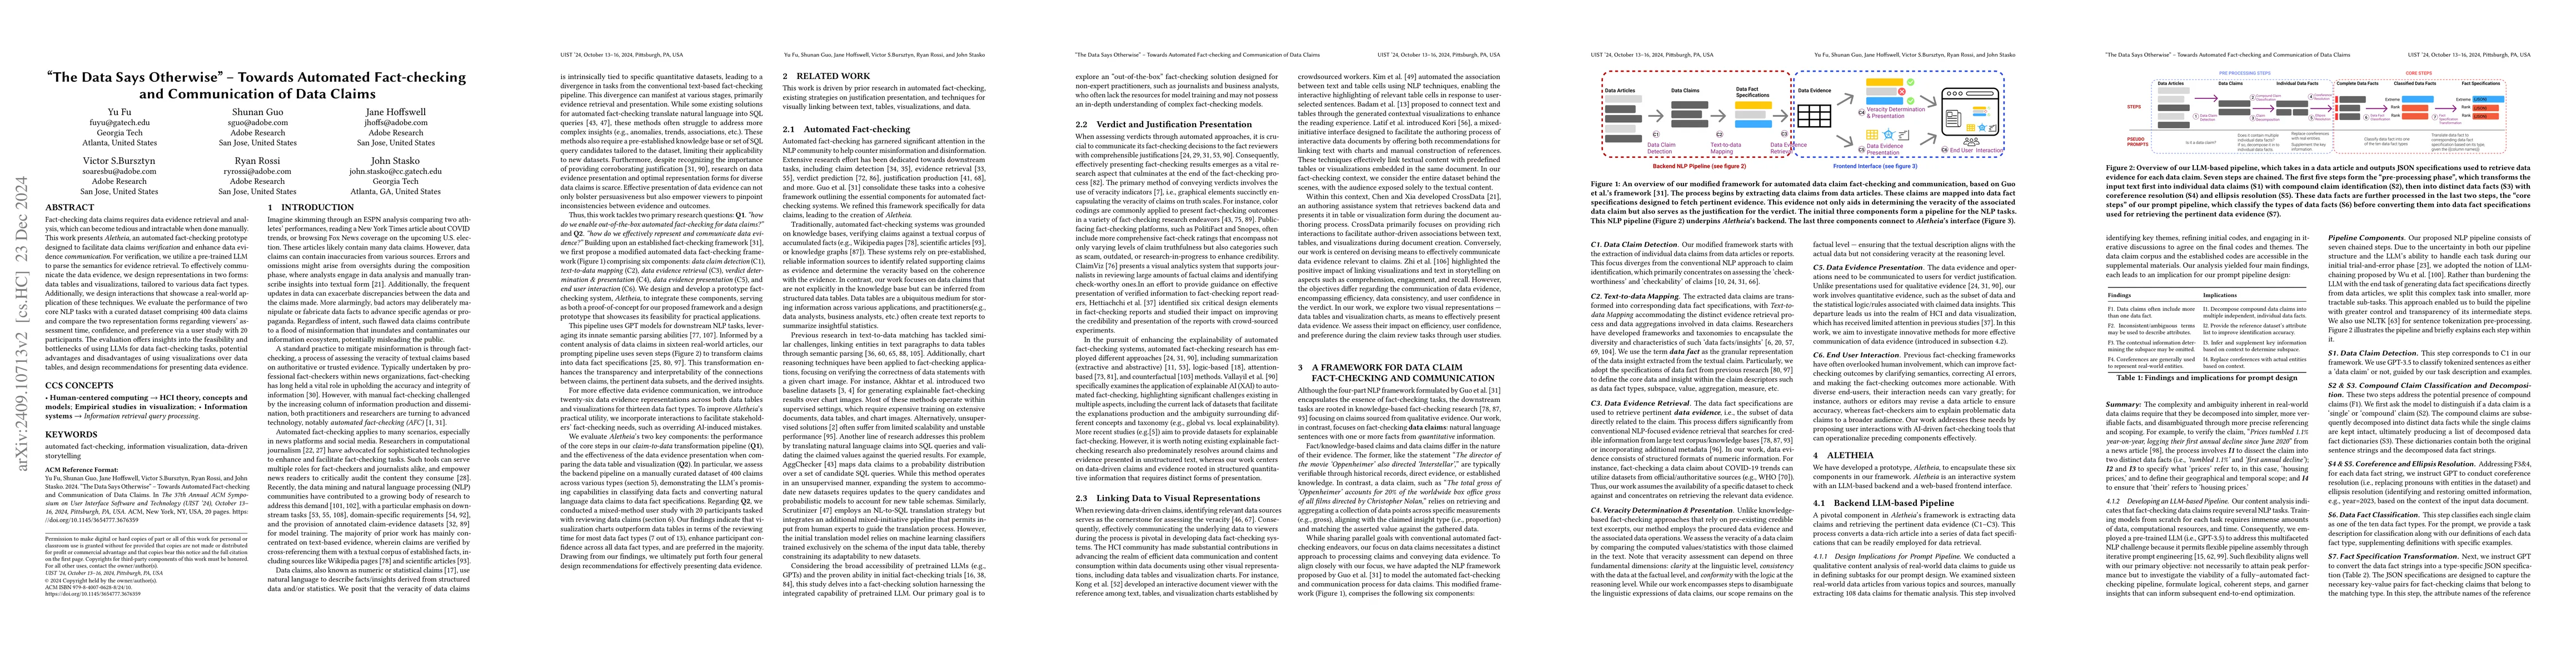
Fact-checking data claims requires data evidence retrieval and analysis, which can become tedious and intractable when done manually. This work presents Aletheia, an automated fact-checking prototype ...
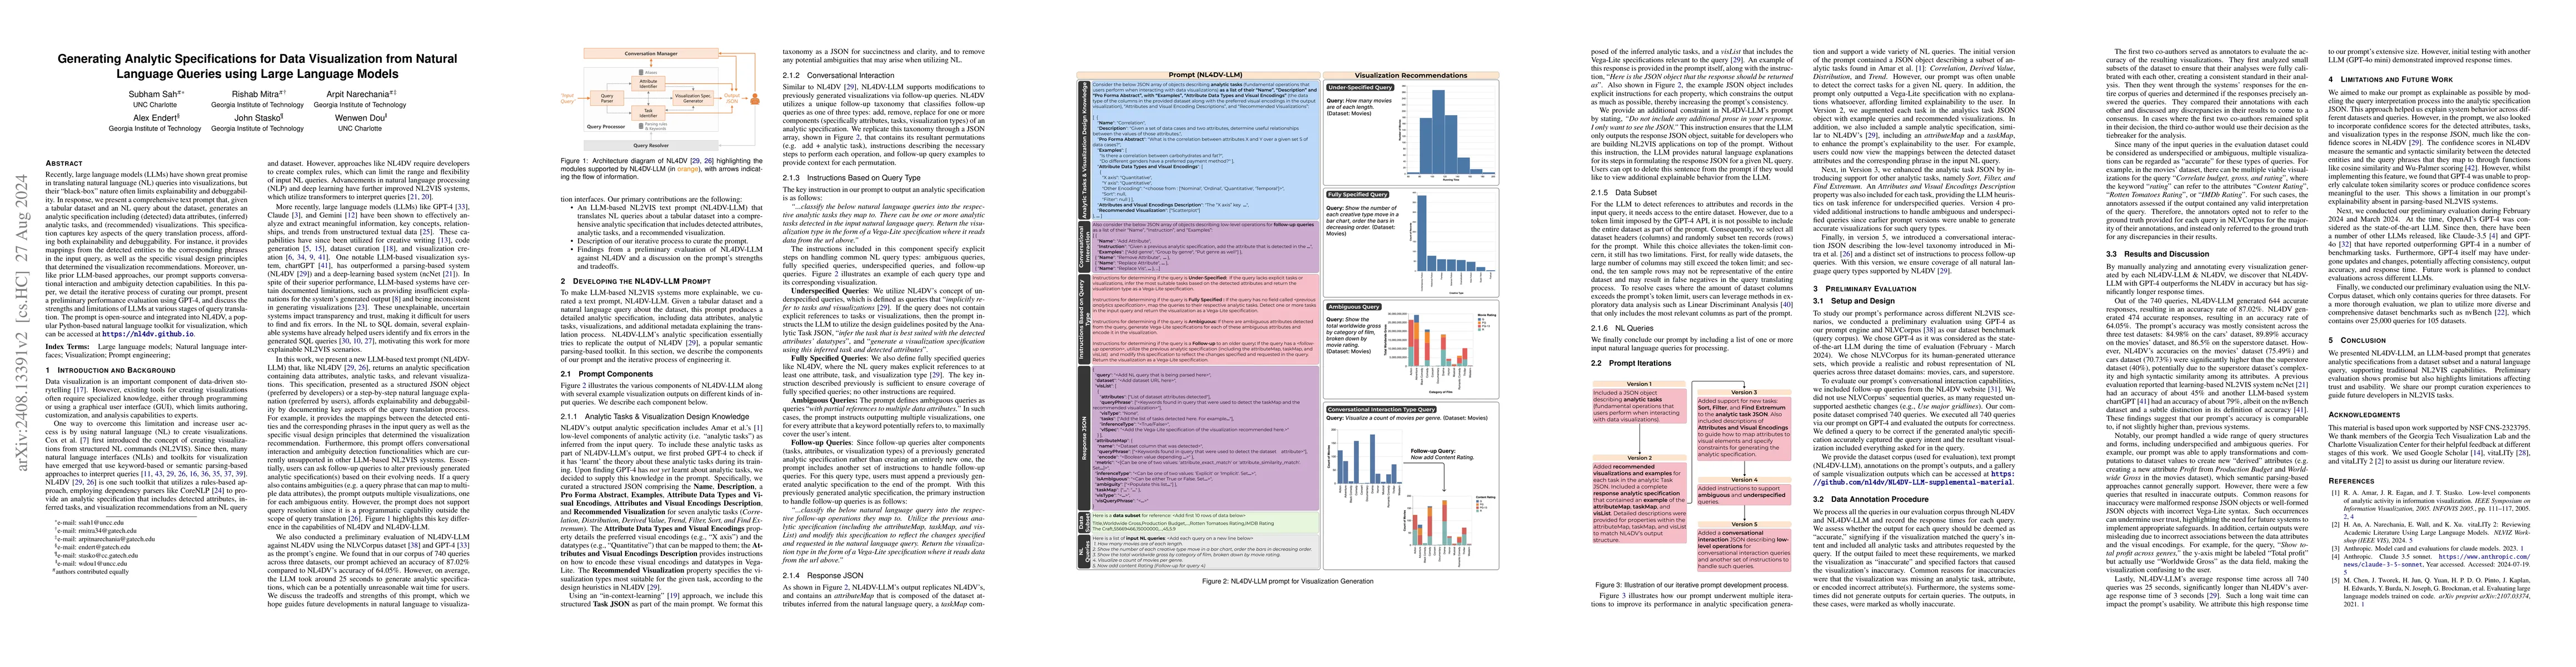
Recently, large language models (LLMs) have shown great promise in translating natural language (NL) queries into visualizations, but their "black-box" nature often limits explainability and debuggabi...
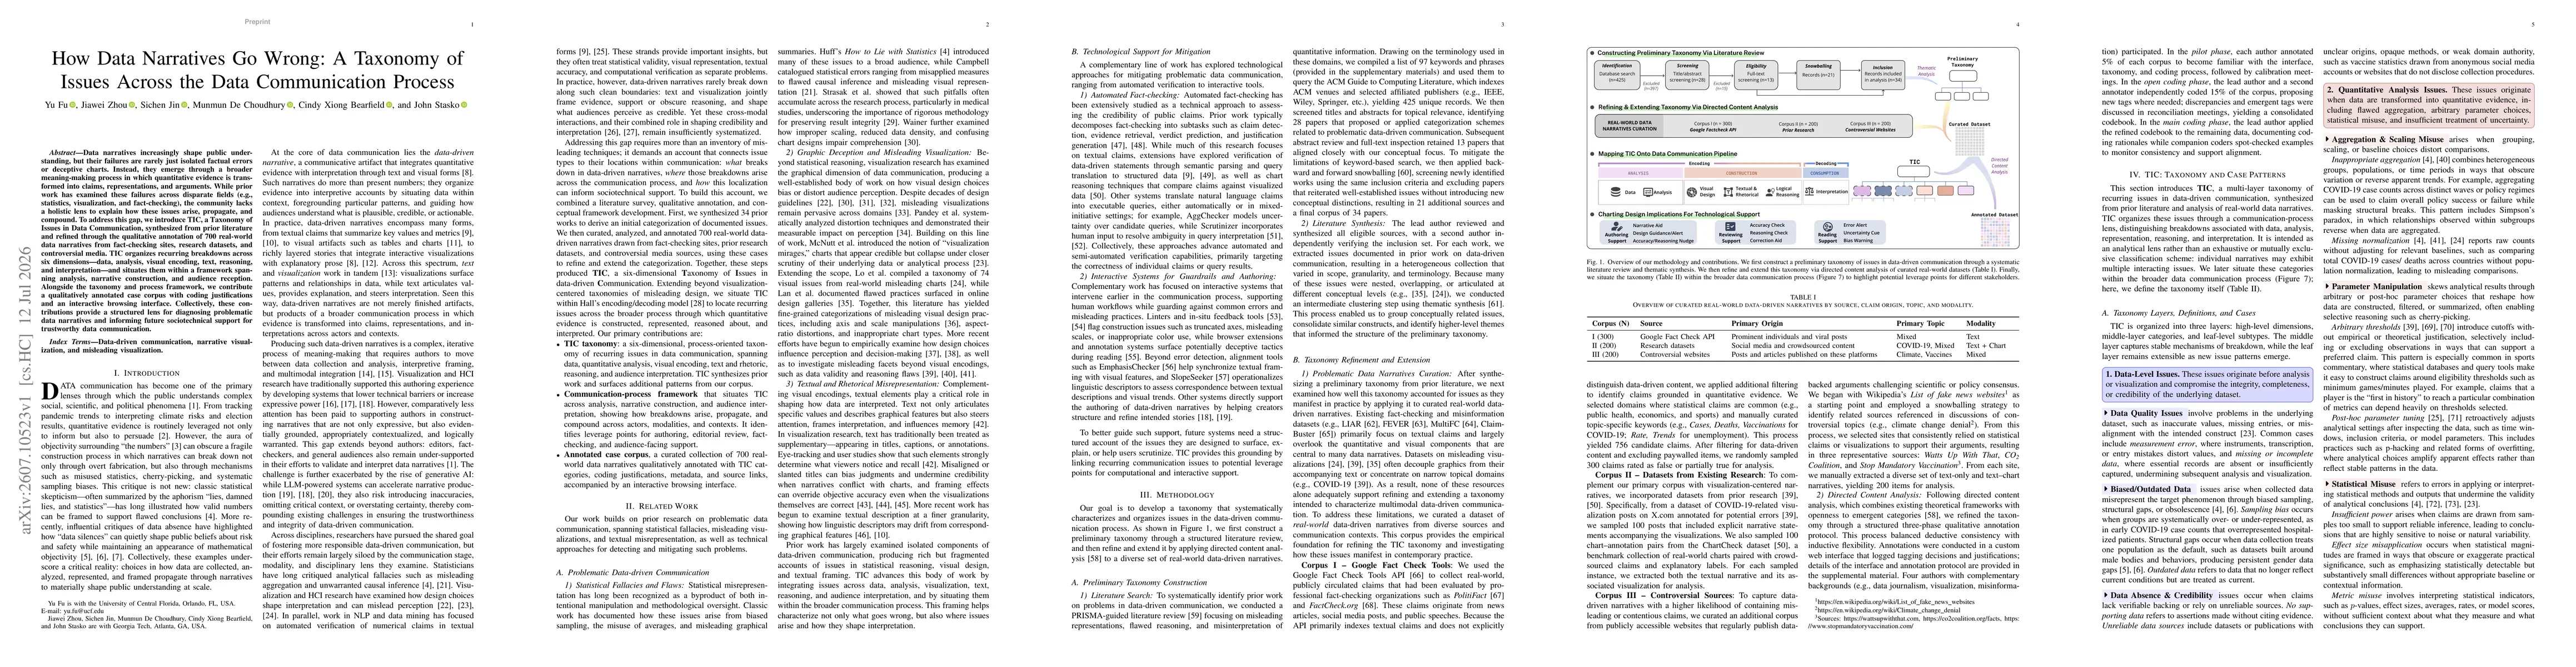
Data narratives increasingly shape public understanding, but their failures are rarely just isolated factual errors or deceptive charts. Instead, they emerge through a broader meaning-making process i...