The study aims to provide a structured understanding of what 'insight' means in the context of automated data tools, filling a gap in current knowledge.
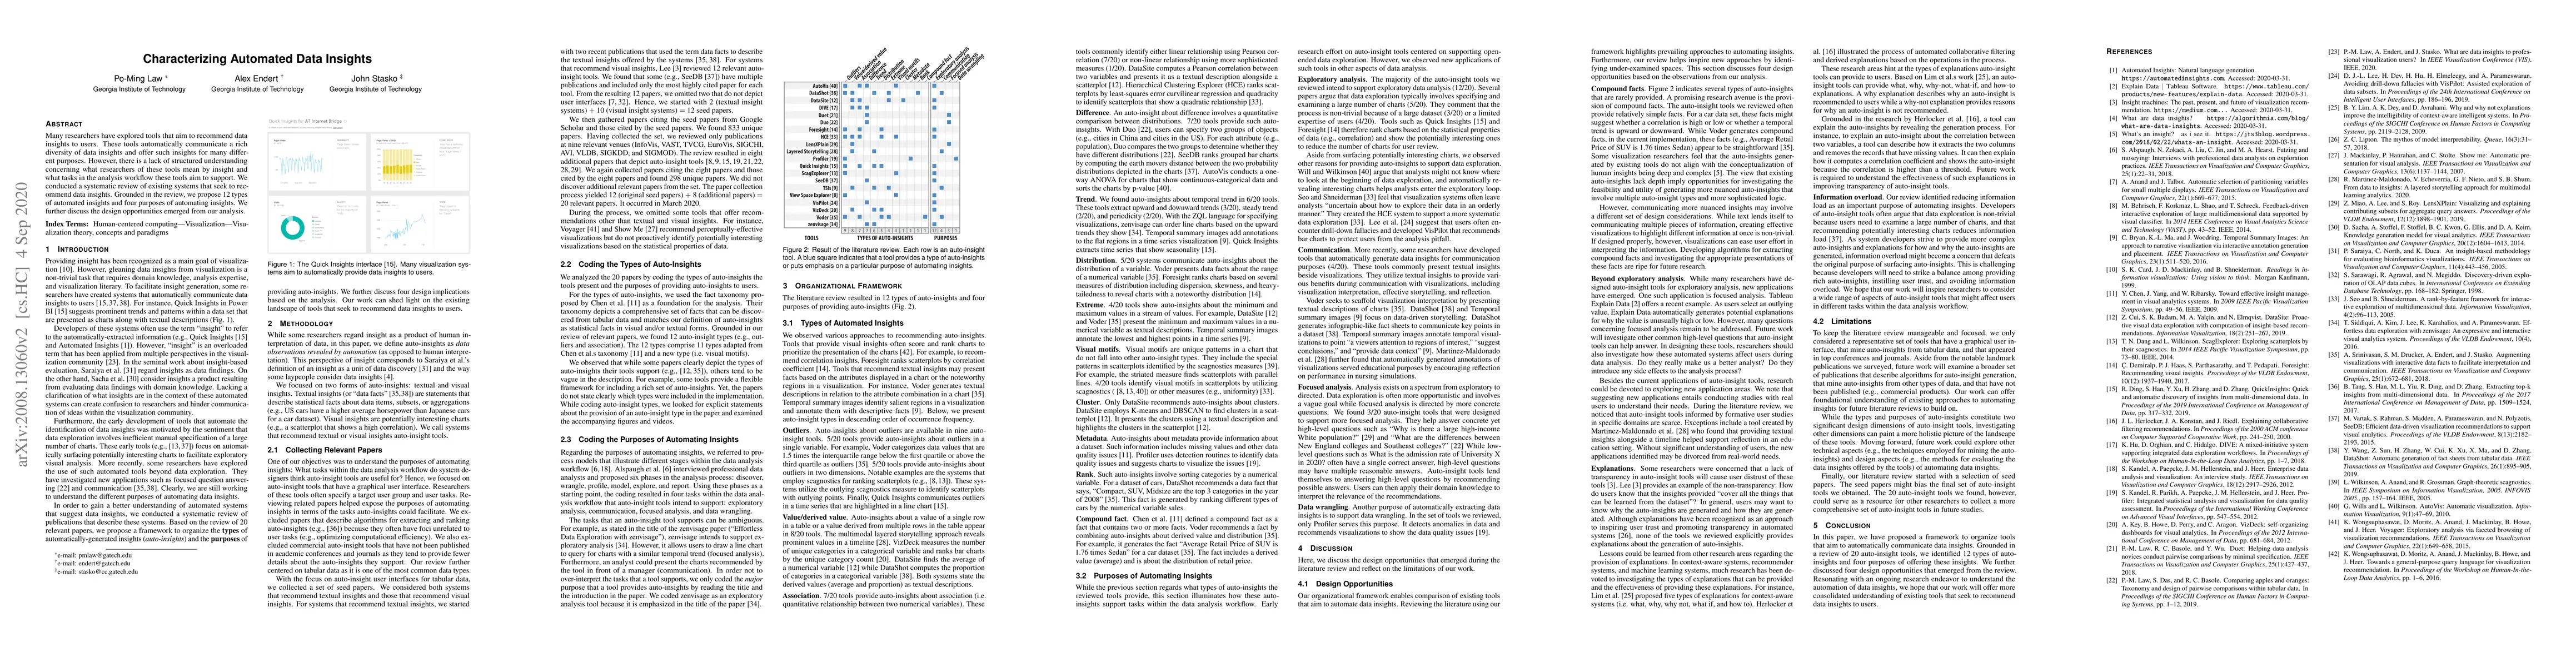
Many researchers have explored tools that aim to recommend data insights to users. These tools automatically communicate a rich diversity of data insights and offer such insights for many different purposes. However, there is a lack of structured understanding concerning what researchers of these tools mean by "insight" and what tasks in the analysis workflow these tools aim to support. We conducted a systematic review of existing systems that seek to recommend data insights. Grounded in the review, we propose 12 types of automated insights and four purposes of automating insights. We further discuss the design opportunities emerged from our analysis.
Get AI-generated insights about this paper's methodology, results, and significance.
Current paper (gray), citations (green), references (blue)
Yong Wang, Dan Zeng, Bo Tang et al.
Ashlesha Akella, Abhijit Manatkar, Parthivi Gupta et al.
Paul Fergus, Carl Chalmers, Naomi Matthews et al.
Title | Authors | Year | Actions |
---|---|---|---|
A Case Study of Human-Authored versus Automatic Dashboard Summaries
|
J. Hoffswell, V. S. Bursztyn, Shunan Guo, E. Koh
|
2025
|
View Paper |
Confirmation Bias: The Double-Edged Sword of Data Facts in Visual Data Communication
|
Shiyao Li, Thomas James Davidson, Cindy Xiong Bearfield, Emily Wall
|
2025
|
View Paper |
An LLM-Based Approach for Insight Generation in Data Analysis
|
Alberto S'anchez P'erez, Alaa Boukhary, Paolo Papotti, Luis Castej'on Lozano, Adam Elwood
|
2025
|
View Paper |
Groot: A System for Editing and Configuring Automated Data Insights
|
Sneha Gathani, Anamaria Crisan, V. Setlur, Arjun Srinivasan
|
2024
|
View Paper |
AutoEDA: Iterative Data Focusing and Exploratory Analysis Based on Attribute Frequency
|
Tong Wu, Song Wang, Xin Peng
|
2024
|
View Paper |
"Show Me What's Wrong!": Combining Charts and Text to Guide Data Analysis
|
Beatriz Feliciano, Rita Costa, Jean V Alves, Javier Li'ebana, Diogo Duarte, Pedro Bizarro
|
2024
|
View Paper |
"The Data Says Otherwise" — Towards Automated Fact-checking and Communication of Data Claims
|
Yu Fu, Shunan Guo, J. Hoffswell, Victor S. Bursztyn, R. Rossi, J. Stasko
|
2024
|
View Paper |
PhilHumans: Benchmarking Machine Learning for Personal Health
|
Vadim Liventsev, Vivek Kumar, Allmin Pradhap Singh Susaiyah, Zixiu "Alex" Wu, Ivan Rodin, Asfand Yaar, Simone Baloccu, Marharyta Beraziuk, S. Battiato, G. Farinella, A. Harma, Rim Helaoui, Milan Petković, D. Recupero, Ehud Reiter, Daniele Riboni, Raymond Sterling
|
2024
|
View Paper |
Visualizing Intelligent Tutor Interactions for Responsive Pedagogy
|
G. Guo, Aishwarya Mudgal Sunil Kumar, Adit Gupta, Adam Joseph Coscia, Christopher J. MacLellan, A. Endert
|
2024
|
View Paper |
Feature-Action Design Patterns for Storytelling Visualizations with Time Series Data
|
Saiful Khan, Scott Jones, Benjamin Bach, Jaehoon Cha, Min Chen, Julie Meikle, Jonathan C. Roberts, J. Thiyagalingam, Jo Wood, Panagiotis D. Ritsos
|
2024
|
View Paper |
A survey on automatic dashboard recommendation systems
|
Praveen Soni, Cyril de Runz, F. Bouali, Gilles Venturini
|
2024
|
View Paper |
Supporting Guided Exploratory Visual Analysis on Time Series Data with Reinforcement Learning
|
Yang Shi, Bingchang Chen, Ying Chen, Zhuochen Jin, Ke Xu, Xiaohan Jiao, Tian Gao, Nan Cao
|
2023
|
View Paper |
The Effect of Smoothing on the Interpretation of Time Series Data: A COVID-19 Case Study
|
Oded Stein, Alec Jacobson, Fanny Chevalier
|
2023
|
View Paper |
WhatsNext: Guidance-enriched Exploratory Data Analysis with Interactive, Low-Code Notebooks
|
Chen Chen, J. Hoffswell, Shunan Guo, R. Rossi, G. Chan, Fan Du, E. Koh, Zhicheng Liu
|
2023
|
View Paper |
Calliope-Net: Automatic Generation of Graph Data Facts via Annotated Node-Link Diagrams
|
Qing Chen, Nan Chen, W. Shuai, Guande Wu, Zhe Xu, H. Tong, Nana Cao
|
2023
|
View Paper |
More Than Data Stories: Broadening the Role of Visualization in Contemporary Journalism
|
Yu Fu, J. Stasko
|
2023
|
View Paper |
WizMap: Scalable Interactive Visualization for Exploring Large Machine Learning Embeddings
|
Zijie J. Wang, Fred Hohman, Duen Horng Chau
|
2023
|
View Paper |
NetworkNarratives: Data Tours for Visual Network Exploration and Analysis
|
Wenchao Li, Sarah Schöttler, James Scott-Brown, Yun Wang, Siming Chen, Huamin Qu, Benjamin Bach
|
2023
|
View Paper |
Notable: On-the-fly Assistant for Data Storytelling in Computational Notebooks
|
Haotian Li, Lu Ying, Haidong Zhang, Yingcai Wu, Huamin Qu, Yun Wang
|
2023
|
View Paper |
Explainable data transformation recommendation for automatic visualization
|
Ziliang Wu, Wei Chen, Yuxin Ma, Tong Xu, Fan Yan, Lei Lv, Zhonghao Qian, Jiazhi Xia
|
2022
|
View Paper |
Understanding How In-Visualization Provenance Can Support Trade-off Analysis
|
Mehdi Chakhchoukh, N. Boukhelifa, A. Bezerianos
|
2022
|
View Paper |
Dashboard Design Patterns
|
B. Bach, Euan Freeman, Alfie Abdul-Rahman, C. Turkay, Saiful Khan, Yulei Fan, Min Chen
|
2022
|
View Paper |
Supporting Accessible Data Visualization Through Audio Data Narratives
|
A. Siu, Gene S-H Kim, Sile O'Modhrain, Sean Follmer
|
2022
|
View Paper |
Recommendations for Visualization Recommendations: Exploring Preferences and Priorities in Public Health
|
Calvin Bao, Siyao Li, Sarah Flores, M. Correll, L. Battle
|
2022
|
View Paper |
Accessible Visualization via Natural Language Descriptions: A Four-Level Model of Semantic Content
|
Alan Lundgard, Arvind Satyanarayan
|
2021
|
View Paper |
Communicating Visualizations without Visuals: Investigation of Visualization Alternative Text for People with Visual Impairments
|
C. Jung, Shubham Mehta, Atharva Kulkarni, Yuhang Zhao, Yea-Seul Kim
|
2021
|
View Paper |
Untidy Data: The Unreasonable Effectiveness of Tables
|
L. Bartram, M. Correll, Melanie Tory
|
2021
|
View Paper |
Multivariate Data Explanation by Jumping Emerging Patterns Visualization
|
Mário Popolin Neto, F. Paulovich
|
2021
|
View Paper |
Accessible Visualization: Design Space, Opportunities, and Challenges
|
N. Kim, Shakila Cherise S. Joyner, A. Riegelhuth, Yea-Seul Kim
|
2021
|
View Paper |
Deconstructing Categorization in Visualization Recommendation: A Taxonomy and Comparative Study
|
D. Lee, V. Setlur, Melanie Tory, Karrie Karahalios, Aditya G. Parameswaran
|
2021
|
View Paper |
Causal Perception in Question-Answering Systems
|
Po-Ming Law, Leo Yu-Ho Lo, A. Endert, J. Stasko, Huamin Qu
|
2020
|
View Paper |
What are Data Insights to Professional Visualization Users?
|
Po-Ming Law, A. Endert, J. Stasko
|
2020
|
View Paper |
A Pilot Study Comparing ChatGPT and Google Search in Supporting Visualization Insight Discovery
|
Chen He, Robin Welsch, Giulio Jacucci
|
2024
|
View Paper |
Accessible Visualization
|
T. V. Landesberger, N. Kim, S. Joyner, A. Riegelhuth, Y. Kim
|
2021
|
View Paper |
Aunt Lily Can Say Her Visualizations: Directing Analysis, Design, and Storytelling in Natural Language (A Vision)
|
Zening Qu, F. Du, R. Rossi
|
2021
|
View Paper |
Edinburgh Research Explorer Dashboard Design Patterns
|
Benjamin Bach, Euan Freeman, Alfie Abdul-Rahman, C. Turkay, Saiful Khan, Yulei Fan, Min Chen
|
View Paper |
Comments (0)