What are Data Insights to Professional Visualization Users?
Publication
Metrics
AI Quick Summary
Their findings highlight the importance of understanding how users interpret and utilize data insights to improve visualization tools and user experience.
Paper Preview
Abstract
While many visualization researchers have attempted to define data insights, little is known about how visualization users perceive them. We interviewed 23 professional users of end-user visualization platforms (e.g., Tableau and Power BI) about their experiences with data insights. We report on seven characteristics of data insights based on interviewees' descriptions. Grounded in these characteristics, we propose practical implications for creating tools that aim to automatically communicate data insights to users.
AI Key Findings
Get AI-generated insights about this paper's methodology, results, significance, and more — seven facets brought into focus.
Impact
Paper Details
Authors
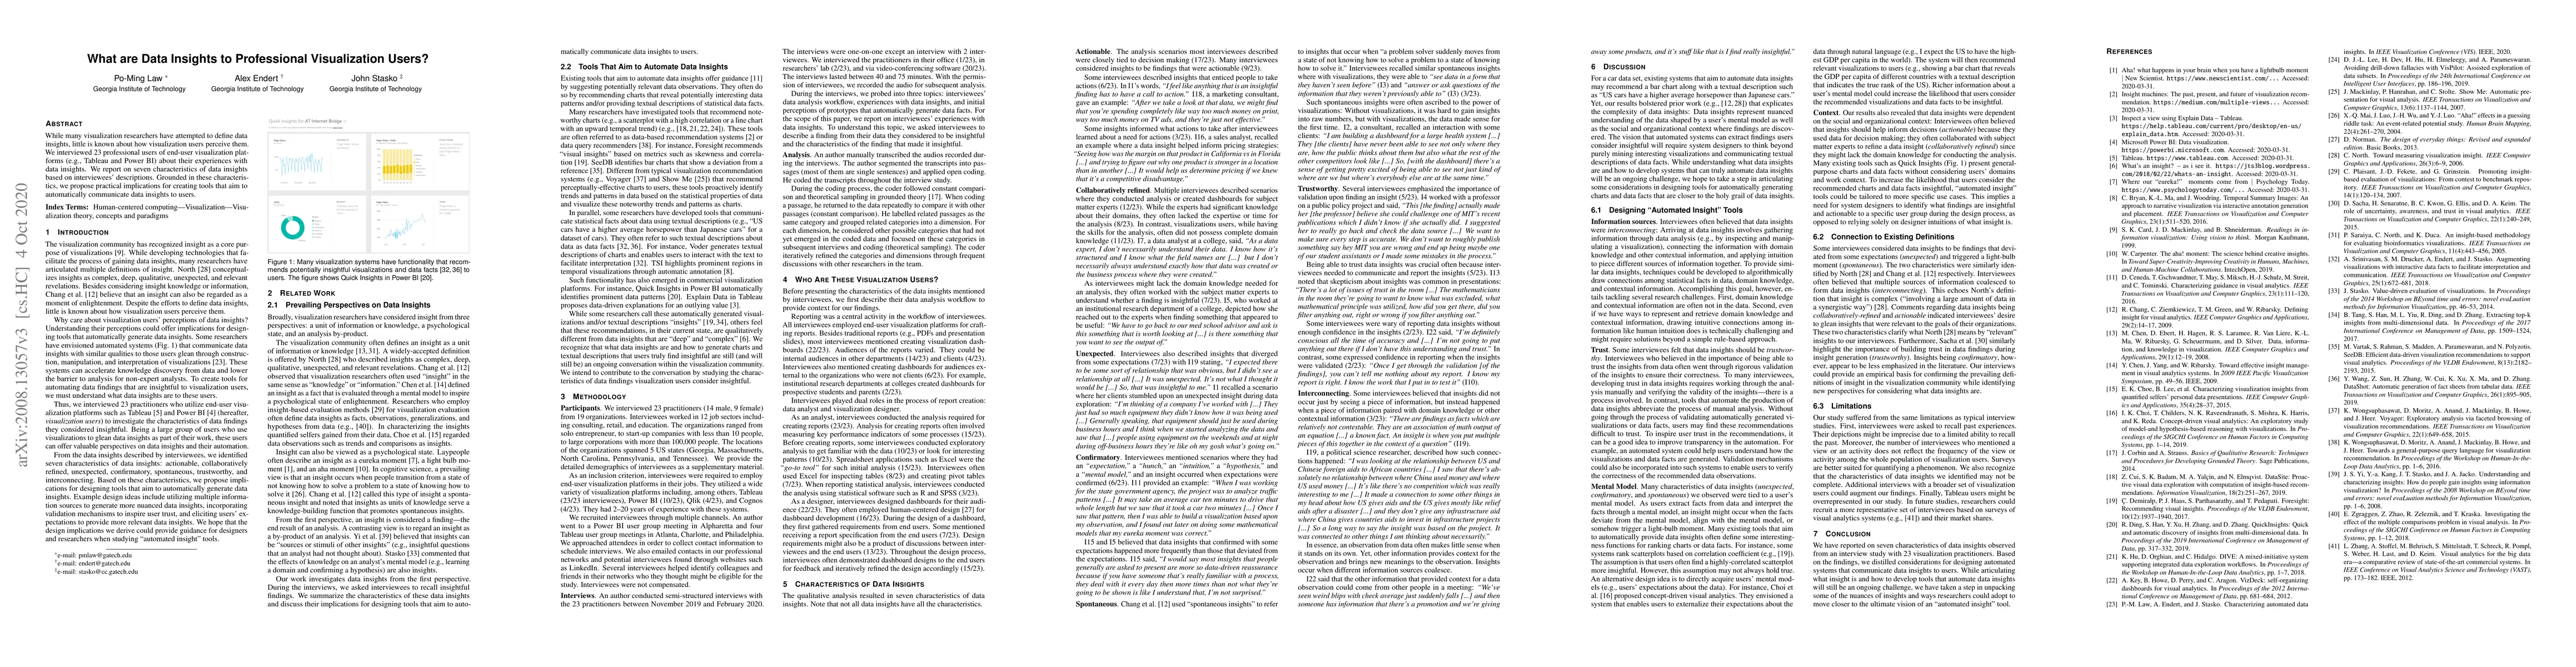
PDF Preview
Key Terms
Citation Network
Current paper (gray), citations (green), references (blue)
Display is limited for performance on very large graphs.
Discussion 0