ChartAdapter: Large Vision-Language Model for Chart Summarization
Publication
Metrics
AI Quick Summary
The paper introduces ChartAdapter, a lightweight transformer module designed to improve the summarization of charts by bridging visual and textual information. The module uses learnable query vectors and a cross-modal alignment projector, integrated with large language models for end-to-end training, achieving superior performance over existing methods on standard datasets.
Paper Preview
Abstract
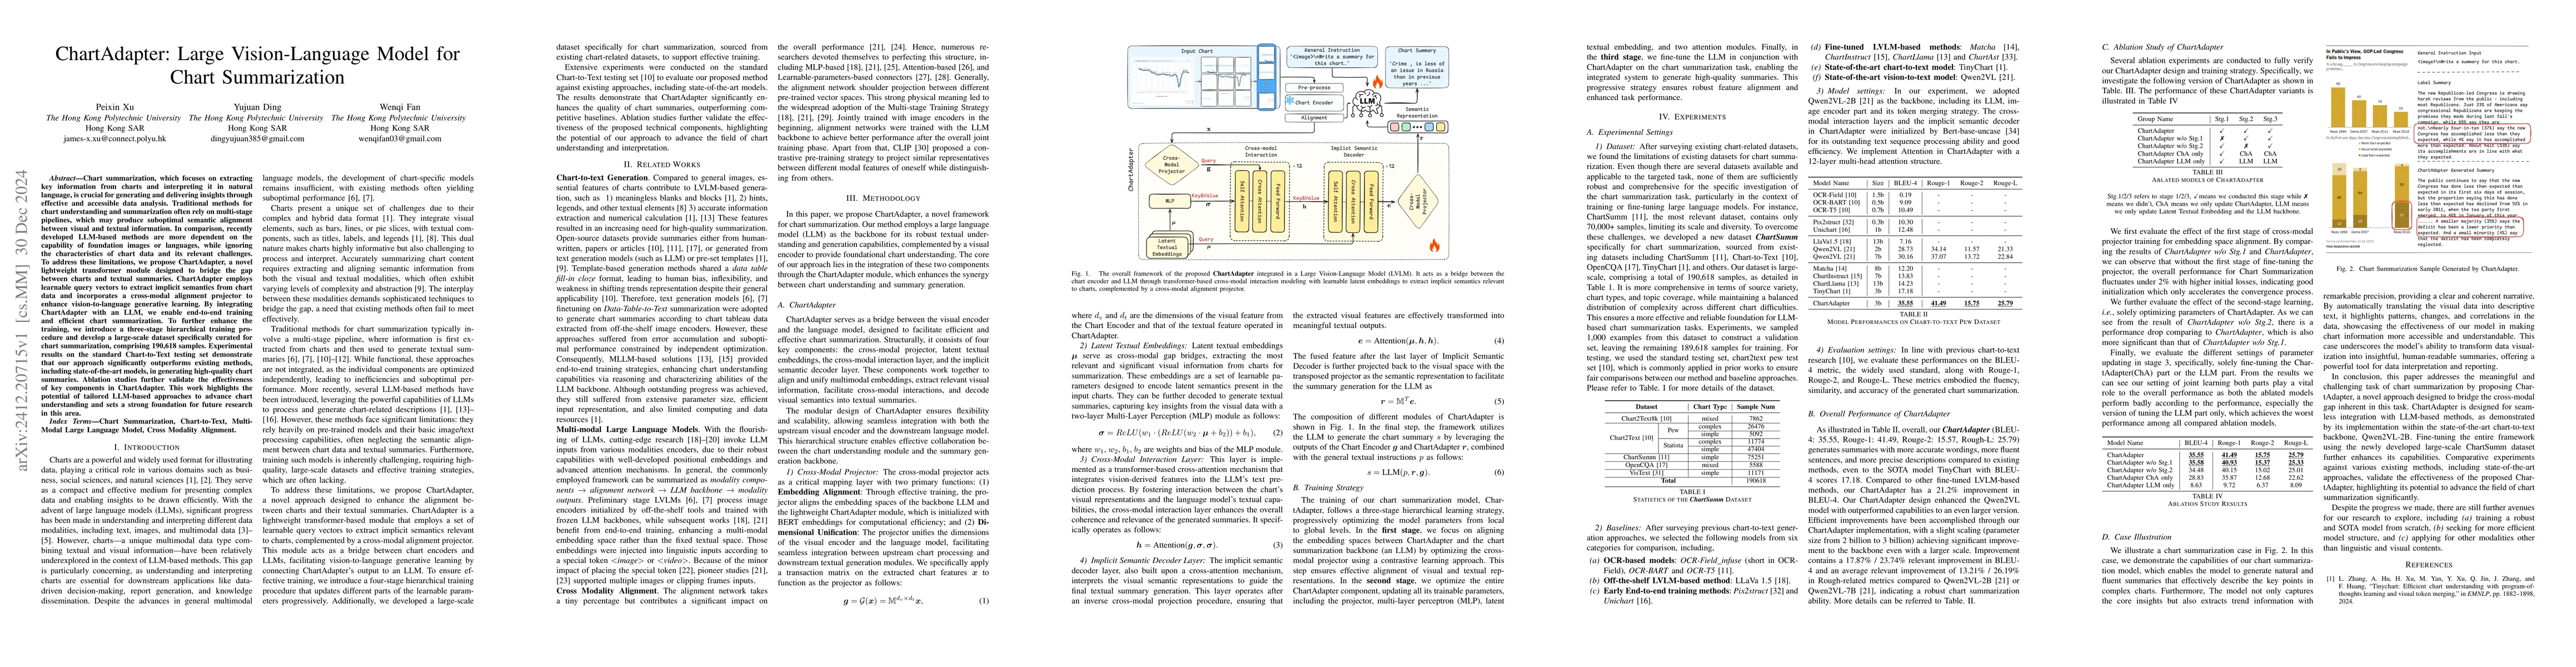
Chart summarization, which focuses on extracting key information from charts and interpreting it in natural language, is crucial for generating and delivering insights through effective and accessible data analysis. Traditional methods for chart understanding and summarization often rely on multi-stage pipelines, which may produce suboptimal semantic alignment between visual and textual information. In comparison, recently developed LLM-based methods are more dependent on the capability of foundation images or languages, while ignoring the characteristics of chart data and its relevant challenges. To address these limitations, we propose ChartAdapter, a novel lightweight transformer module designed to bridge the gap between charts and textual summaries. ChartAdapter employs learnable query vectors to extract implicit semantics from chart data and incorporates a cross-modal alignment projector to enhance vision-to-language generative learning. By integrating ChartAdapter with an LLM, we enable end-to-end training and efficient chart summarization. To further enhance the training, we introduce a three-stage hierarchical training procedure and develop a large-scale dataset specifically curated for chart summarization, comprising 190,618 samples. Experimental results on the standard Chart-to-Text testing set demonstrate that our approach significantly outperforms existing methods, including state-of-the-art models, in generating high-quality chart summaries. Ablation studies further validate the effectiveness of key components in ChartAdapter. This work highlights the potential of tailored LLM-based approaches to advance chart understanding and sets a strong foundation for future research in this area.
AI Key Findings
Get AI-generated insights about this paper's methodology, results, significance, and more — seven facets brought into focus.
Impact
Authors
PDF Preview
Citation Network
Current paper (gray), citations (green), references (blue)
Display is limited for performance on very large graphs.
Discussion 0