ChartDETR: A Multi-shape Detection Network for Visual Chart Recognition
Publication
Metrics
AI Quick Summary
ChartDETR introduces a transformer-based multi-shape detection network for visual chart recognition, localizing keypoints to reconstruct data elements without post-processing errors. It achieves state-of-the-art results on multiple datasets, demonstrating its effectiveness across diverse chart types.
Paper Preview
Abstract
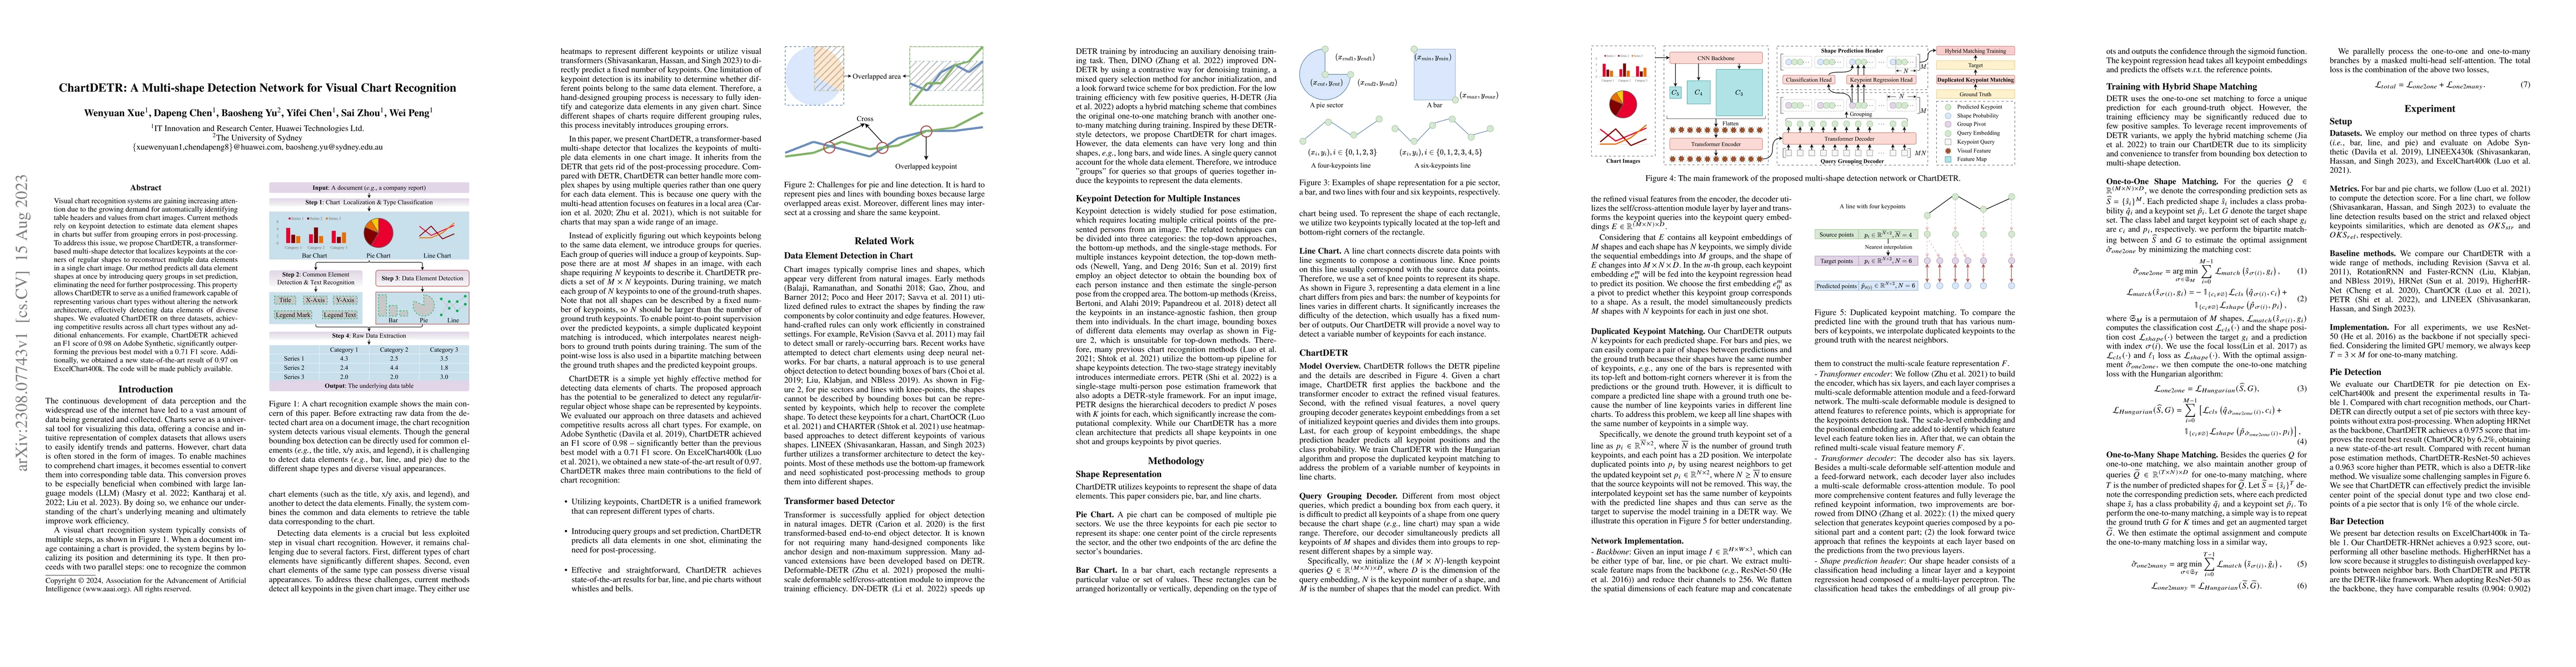
Visual chart recognition systems are gaining increasing attention due to the growing demand for automatically identifying table headers and values from chart images. Current methods rely on keypoint detection to estimate data element shapes in charts but suffer from grouping errors in post-processing. To address this issue, we propose ChartDETR, a transformer-based multi-shape detector that localizes keypoints at the corners of regular shapes to reconstruct multiple data elements in a single chart image. Our method predicts all data element shapes at once by introducing query groups in set prediction, eliminating the need for further postprocessing. This property allows ChartDETR to serve as a unified framework capable of representing various chart types without altering the network architecture, effectively detecting data elements of diverse shapes. We evaluated ChartDETR on three datasets, achieving competitive results across all chart types without any additional enhancements. For example, ChartDETR achieved an F1 score of 0.98 on Adobe Synthetic, significantly outperforming the previous best model with a 0.71 F1 score. Additionally, we obtained a new state-of-the-art result of 0.97 on ExcelChart400k. The code will be made publicly available.
AI Key Findings
Get AI-generated insights about this paper's methodology, results, significance, and more — seven facets brought into focus.
Impact
Paper Details
Authors
PDF Preview
Key Terms
Citation Network
Current paper (gray), citations (green), references (blue)
Display is limited for performance on very large graphs.
Discussion 0