AI Quick Summary
The ChartFormer model converts raster chart images into tactile-accessible SVGs, leveraging vision-language techniques. Its effectiveness is evaluated via a pilot study using a refreshable tactile display, addressing the need for accessible data visualizations for the visually impaired.
Paper Preview
Abstract
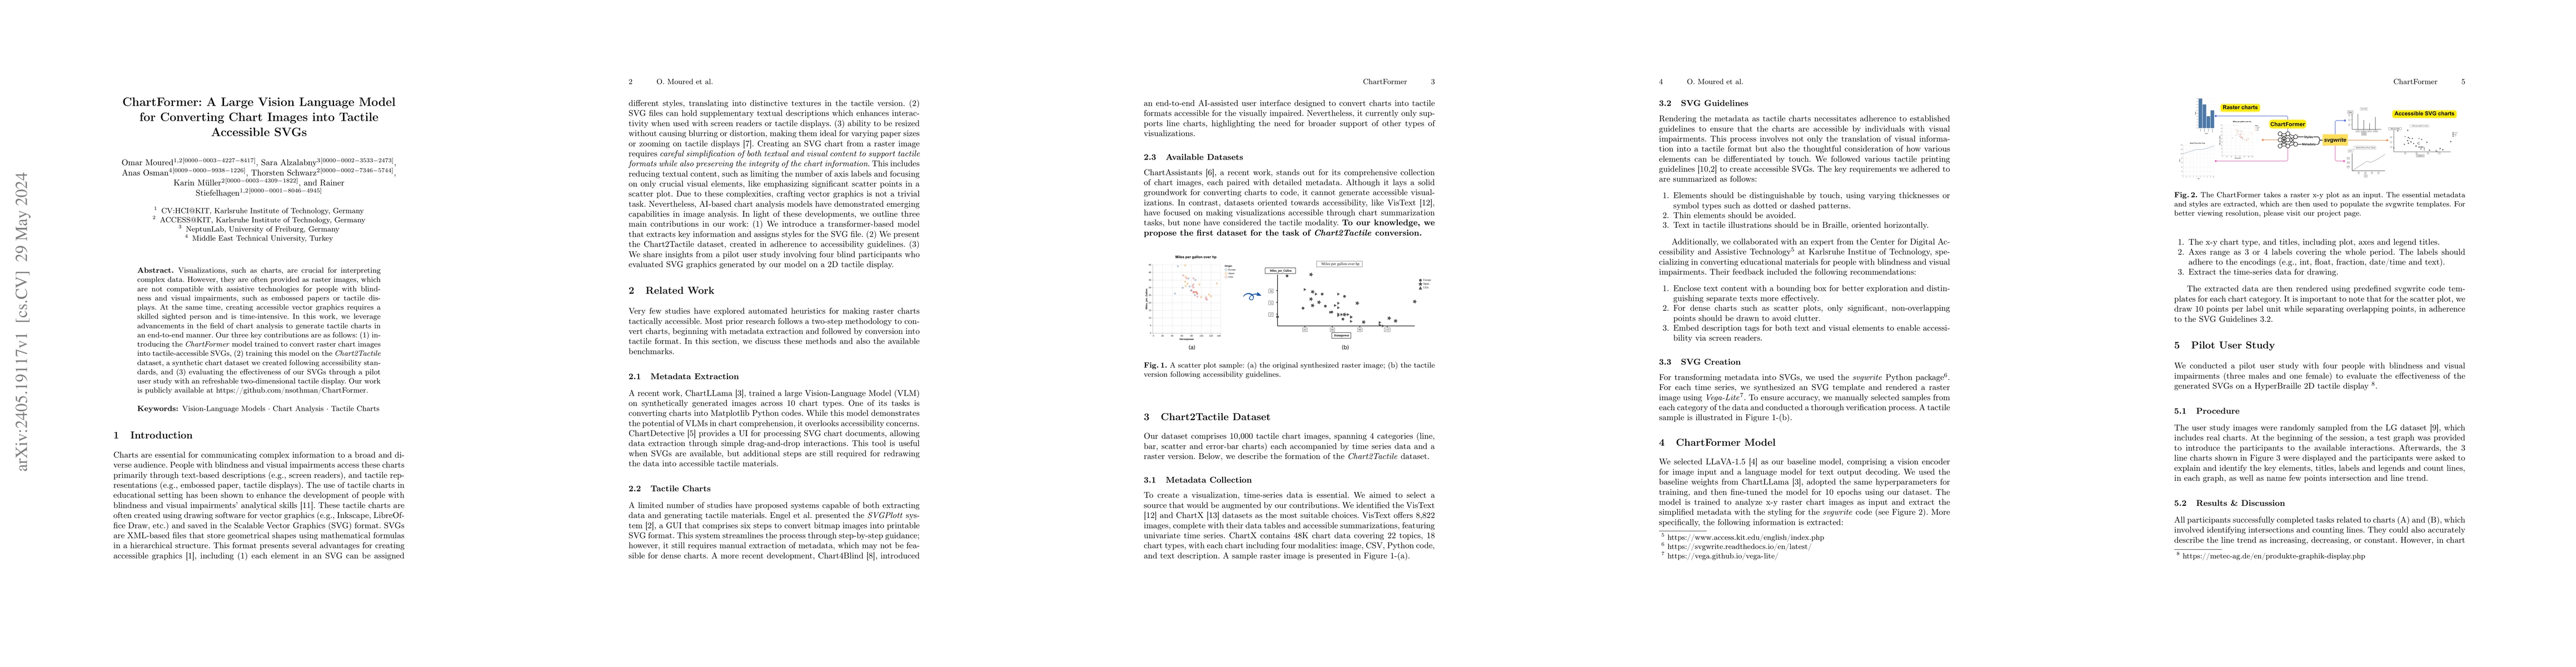
Visualizations, such as charts, are crucial for interpreting complex data. However, they are often provided as raster images, which are not compatible with assistive technologies for people with blindness and visual impairments, such as embossed papers or tactile displays. At the same time, creating accessible vector graphics requires a skilled sighted person and is time-intensive. In this work, we leverage advancements in the field of chart analysis to generate tactile charts in an end-to-end manner. Our three key contributions are as follows: (1) introducing the ChartFormer model trained to convert raster chart images into tactile-accessible SVGs, (2) training this model on the Chart2Tactile dataset, a synthetic chart dataset we created following accessibility standards, and (3) evaluating the effectiveness of our SVGs through a pilot user study with an refreshable two-dimensional tactile display. Our work is publicly available at https://github.com/nsothman/ChartFormer .
AI Key Findings
Get AI-generated insights about this paper's methodology, results, and significance.
Paper Details
How to Cite This Paper
@article{osman2024chartformer,
  title         = {ChartFormer: A Large Vision Language Model for Converting Chart Images
  into Tactile Accessible SVGs},
  author        = {Osman, Anas and Muller, Karin and Moured, Omar and others},
  year          = {2024},
  eprint        = {2405.19117},
  archivePrefix = {arXiv},
  primaryClass  = {cs.CV},
}Osman, A., Muller, K., Moured, O., Stiefelhagen, R., Alzalabny, S., & Schwarz, T. (2024). ChartFormer: A Large Vision Language Model for Converting Chart Images
into Tactile Accessible SVGs. arXiv. https://arxiv.org/abs/2405.19117Osman, Anas, et al. "ChartFormer: A Large Vision Language Model for Converting Chart Images
into Tactile Accessible SVGs." arXiv, 2024, arxiv.org/abs/2405.19117.PDF Preview
Key Terms
Citation Network
Current paper (gray), citations (green), references (blue)
Display is limited for performance on very large graphs.
Similar Papers
Found 4 papersChartAdapter: Large Vision-Language Model for Chart Summarization
Peixin Xu, Yujuan Ding, Wenqi Fan
Flowchart2Mermaid: A Vision-Language Model Powered System for Converting Flowcharts into Editable Diagram Code
Pritam Deka, Barry Devereux
A Lightweight Large Vision-language Model for Multimodal Medical Images
Belal Alsinglawi, Chris McCarthy, Sara Webb et al.
Robotic Perception with a Large Tactile-Vision-Language Model for Physical Property Inference
Zexiang Guo, Hengxiang Chen, Xinheng Mai et al.
| Title | Authors | Year | Actions |
|---|
Comments (0)