ArxivLens

Quick Summary:

ChartNet employs MAC-Networks to reason over statistical charts by classifying and regressing to answer predefined and open-ended questions, outperforming other methods on a custom dataset. This approach demonstrates potential for applications involving visual reasoning in statistical charts.

Journal Reference: International Joint Conference on Neural Networks (IJCNN) 2019
DOI: 10.1109/IJCNN.2019.8852427
arXiv Id: 1911.09375
Date Published: 2019-11-22
Date Updated: 2019-11-22

Categories:

Key Terms (TF-IDF):

answers (0.345)
answers (0.335)
reasoning (0.263)
reasoning (0.256)
perception (0.226)
statistical (0.219)
perception (0.218)
statistical (0.216)
questions (0.190)
questions (0.189)
images (0.189)
images (0.185)
visual (0.178)
visual (0.178)
layer (0.162)
classification (0.157)
layer (0.156)
classification (0.154)
textual (0.140)
replacing (0.137)
License: http://arxiv.org/licenses/nonexclusive-distrib/1.0/

Summary:

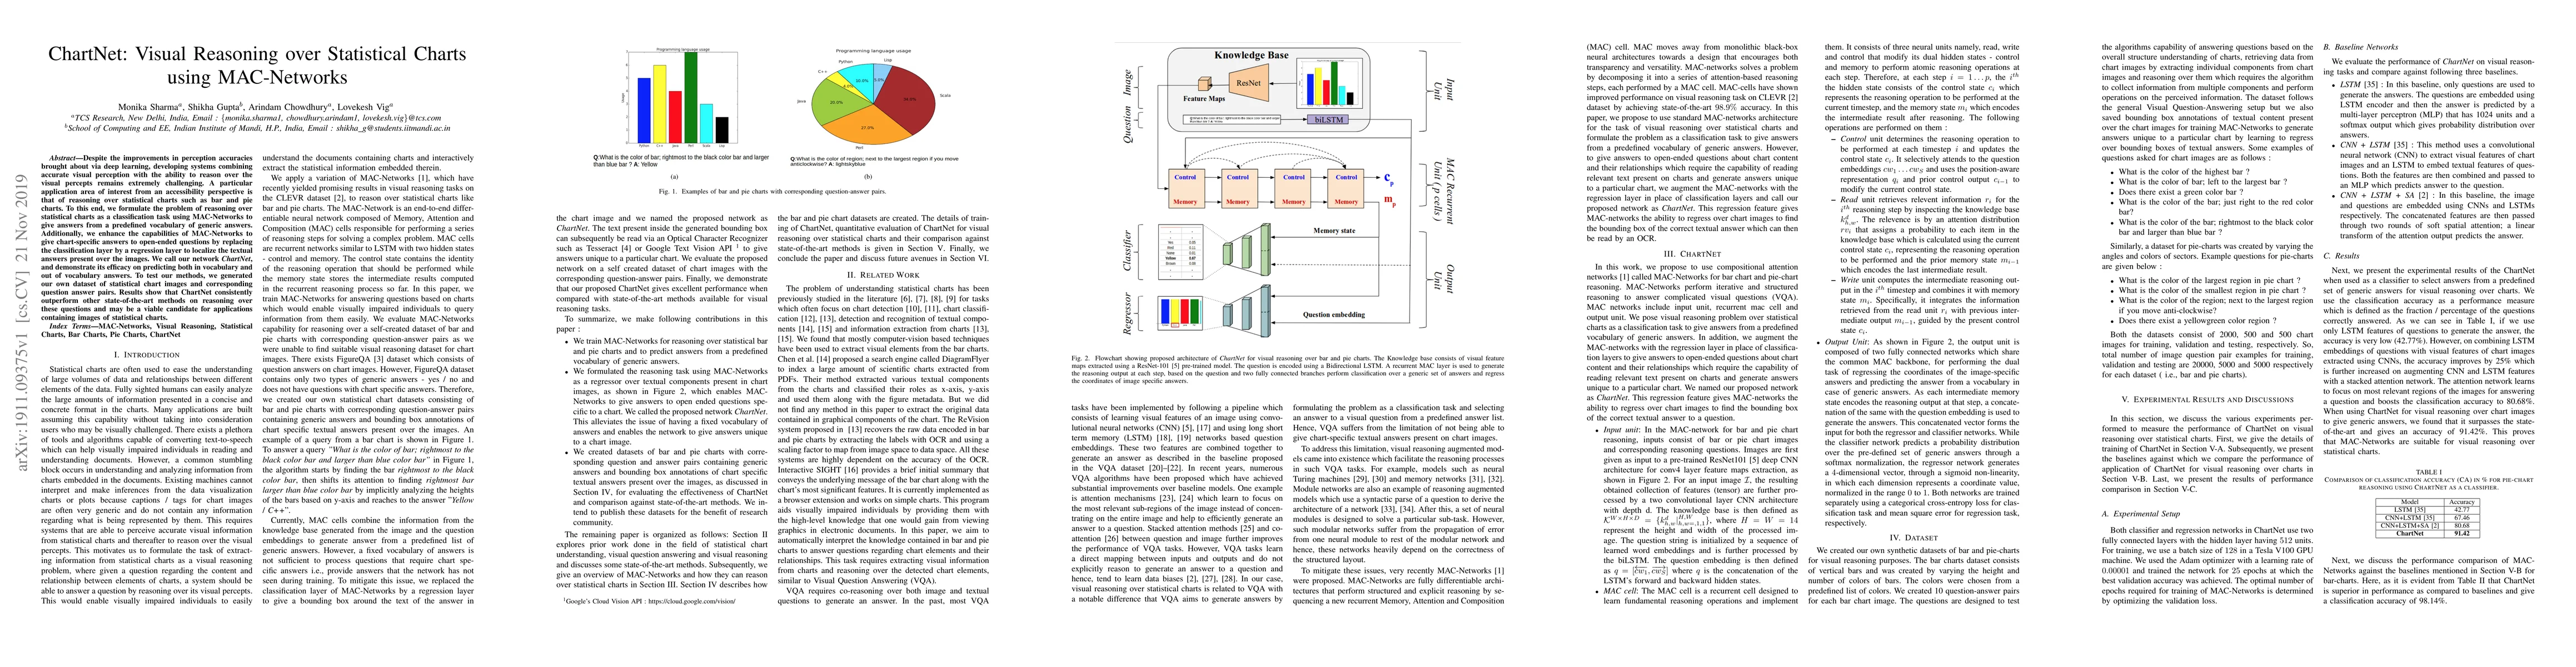
Despite the improvements in perception accuracies brought about via deep learning, developing systems combining accurate visual perception with the ability to reason over the visual percepts remains extremely challenging. A particular application area of interest from an accessibility perspective is that of reasoning over statistical charts such as bar and pie charts. To this end, we formulate the problem of reasoning over statistical charts as a classification task using MAC-Networks to give answers from a predefined vocabulary of generic answers. Additionally, we enhance the capabilities of MAC-Networks to give chart-specific answers to open-ended questions by replacing the classification layer by a regression layer to localize the textual answers present over the images. We call our network ChartNet, and demonstrate its efficacy on predicting both in vocabulary and out of vocabulary answers. To test our methods, we generated our own dataset of statistical chart images and corresponding question answer pairs. Results show that ChartNet consistently outperform other state-of-the-art methods on reasoning over these questions and may be a viable candidate for applications containing images of statistical charts.

Citation & Reference Network Visualization

This graph shows how this paper is connected to other research. The current paper is shown in dark gray, papers that cite it are in green, and papers it references are in blue. You can:

Current Paper
Papers citing this work (Citations)
Papers cited by this work (References)

• Hover over any node to see the paper title

• Click a node to view that paper's details

• Drag nodes to rearrange the graph

• Use the zoom controls (bottom right) to zoom in/out

Citations and References

Title Authors Year Actions
Chart question answering with multimodal graph representation learning and zero-shot classification
Ali Mazraeh Farahani, Peyman Adibi, Sayyed Mohammad Saeed Ehsani, Hans-Peter Hutter, Alireza Darvishy
2025
View Paper
ChartKG: A Knowledge-Graph-Based Representation for Chart Images
Zhiguang Zhou, Haoxuan Wang, Zhengqing Zhao, Fengling Zheng, Yongheng Wang, Wei Chen, Yong Wang
2024
View Paper
The State of the Art in Creating Visualization Corpora for Automated Chart Analysis
Chen Chen, Zhicheng Liu
2023
View Paper
Exploring Chart Question Answering for Blind and Low Vision Users
Jiho Kim, Arjun Srinivasan, N. Kim, Yea-Seul Kim
2023
View Paper
Parsing Line Chart Images Using Linear Programming
Hajime Kato, Mitsuru Nakazawa, Hsuan-Kung Yang, Mark Chen, B. Stenger
2022
View Paper
Information Extraction from Document Images via FCA based Template Detection and Knowledge Graph Rule Induction
M. Rastogi, Syed Afshan Ali, Mrinal Rawat, L. Vig, Puneet Agarwal, Gautam M. Shroff, A. Srinivasan
2020
View Paper
Chart Mining: A Survey of Methods for Automated Chart Analysis
Kenny Davila, Srirangaraj Setlur, D. Doermann, Urala Kota Bhargava, V. Govindaraju
2020
View Paper
Automatic Chart Understanding: A Review
Ali Mazraeh Farahani, Peyman Adibi, M. Ehsani, H. Hutter, Alireza Darvishy
2023
View Paper
Towards Assisting the Visually Impaired: A Review on Techniques for Decoding the Visual Data From Chart Images
K. C. Shahira, A. Lijiya
2021
View Paper

Similar Papers

Comments (0)

This website uses cookies to ensure you get the best experience. Learn more