ChartText: Linking Text with Charts in Documents
Publication
Metrics
Paper Preview
Abstract
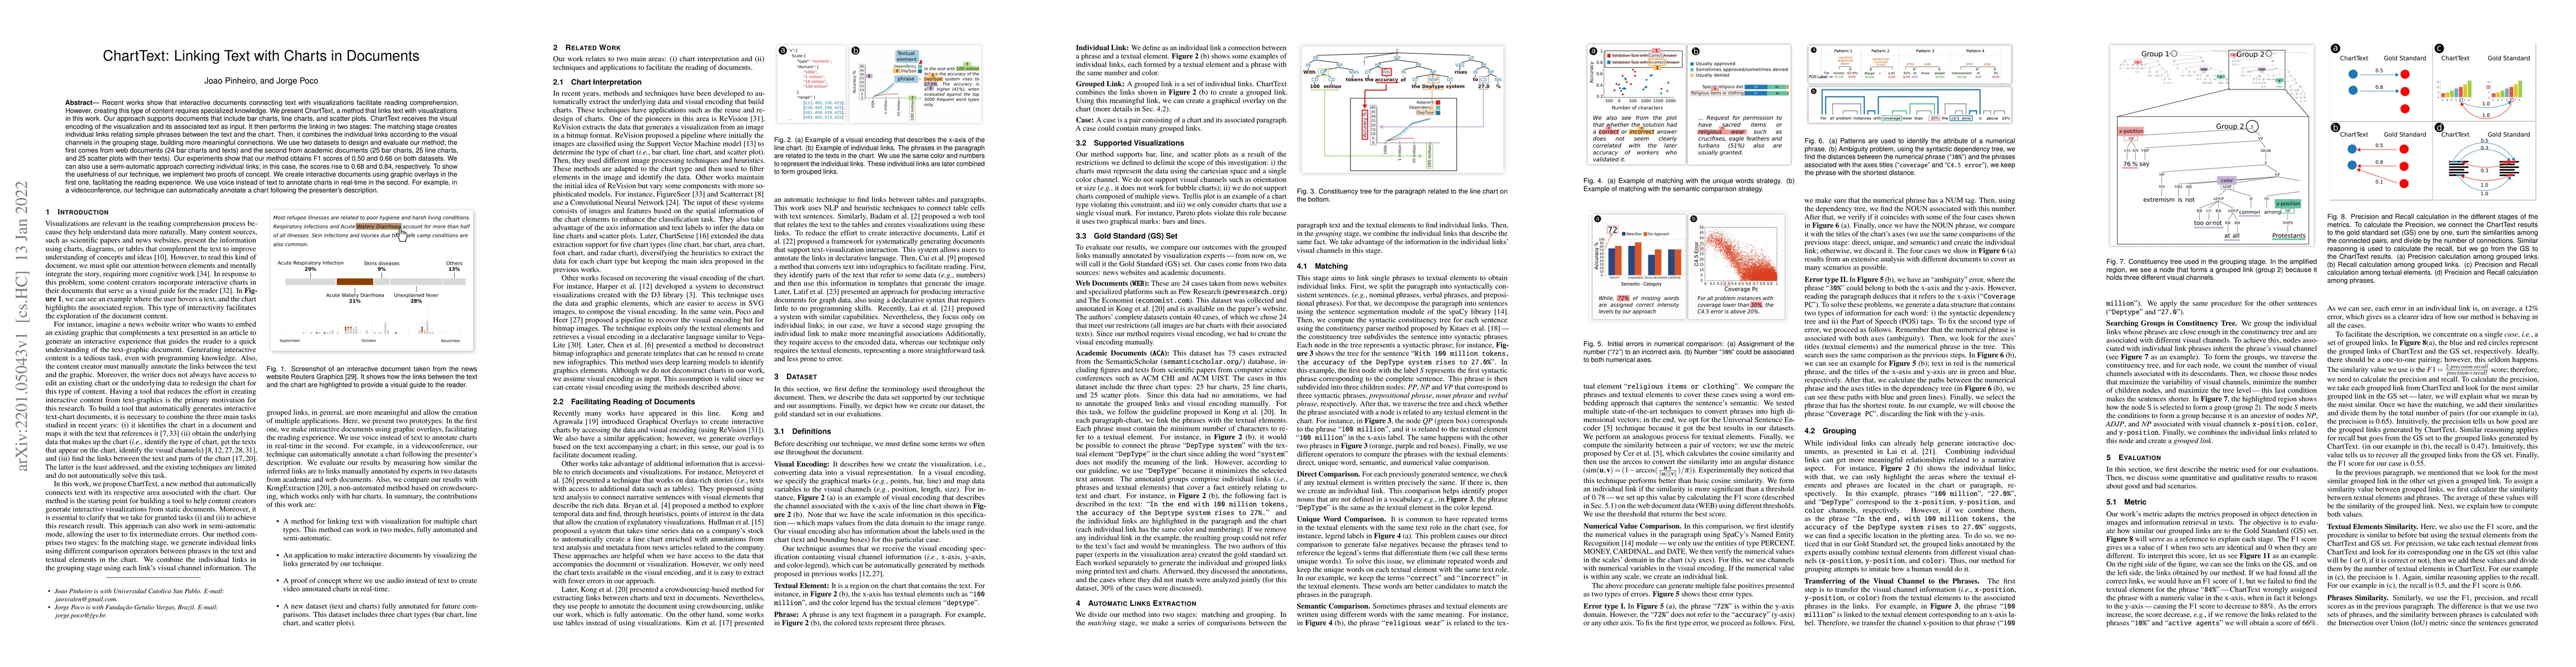
Recent works show that interactive documents connecting text with visualizations facilitate reading comprehension. However, creating this type of content requires specialized knowledge. We present ChartText, a method that links text with visualizations in this work. Our approach supports documents that include bar charts, line charts, and scatter plots. ChartText receives the visual encoding of the visualization and its associated text as input. It then performs the linking in two stages: The matching stage creates individual links relating simple phrases between the text and the chart. Then, it combines the individual links according to the visual channels in the grouping stage, building more meaningful connections. We use two datasets to design and evaluate our method; the first comes from web documents (24 bar charts and texts) and the second from academic documents (25 bar charts, 25 line charts, and 25 scatter plots with their texts). Our experiments show that our method obtains F1 scores of 0.50 and 0.66 on both datasets. We can also use a semi-automatic approach correcting individual links; in this case, the scores rise to 0.68 and 0.84, respectively. To show the usefulness of our technique, we implement two proofs of concept. We create interactive documents using graphic overlays in the first one, facilitating the reading experience. We use voice instead of text to annotate charts in real-time in the second. For example, in a videoconference, our technique can automatically annotate a chart following the presenter's description.
AI Key Findings
Get AI-generated insights about this paper's methodology, results, significance, and more — seven facets brought into focus.
Impact
Paper Details
Authors
PDF Preview
Key Terms
Citation Network
Current paper (gray), citations (green), references (blue)
Display is limited for performance on very large graphs.
Discussion 0