The paper explores methods to enhance the integration of text and charts in data documents, developing a mixed-initiative interface that facilitates interactive references between them. The study suggests that this interface effectively supports the creation of cohesive data documents by reducing the need for readers to shift attention between text and charts.
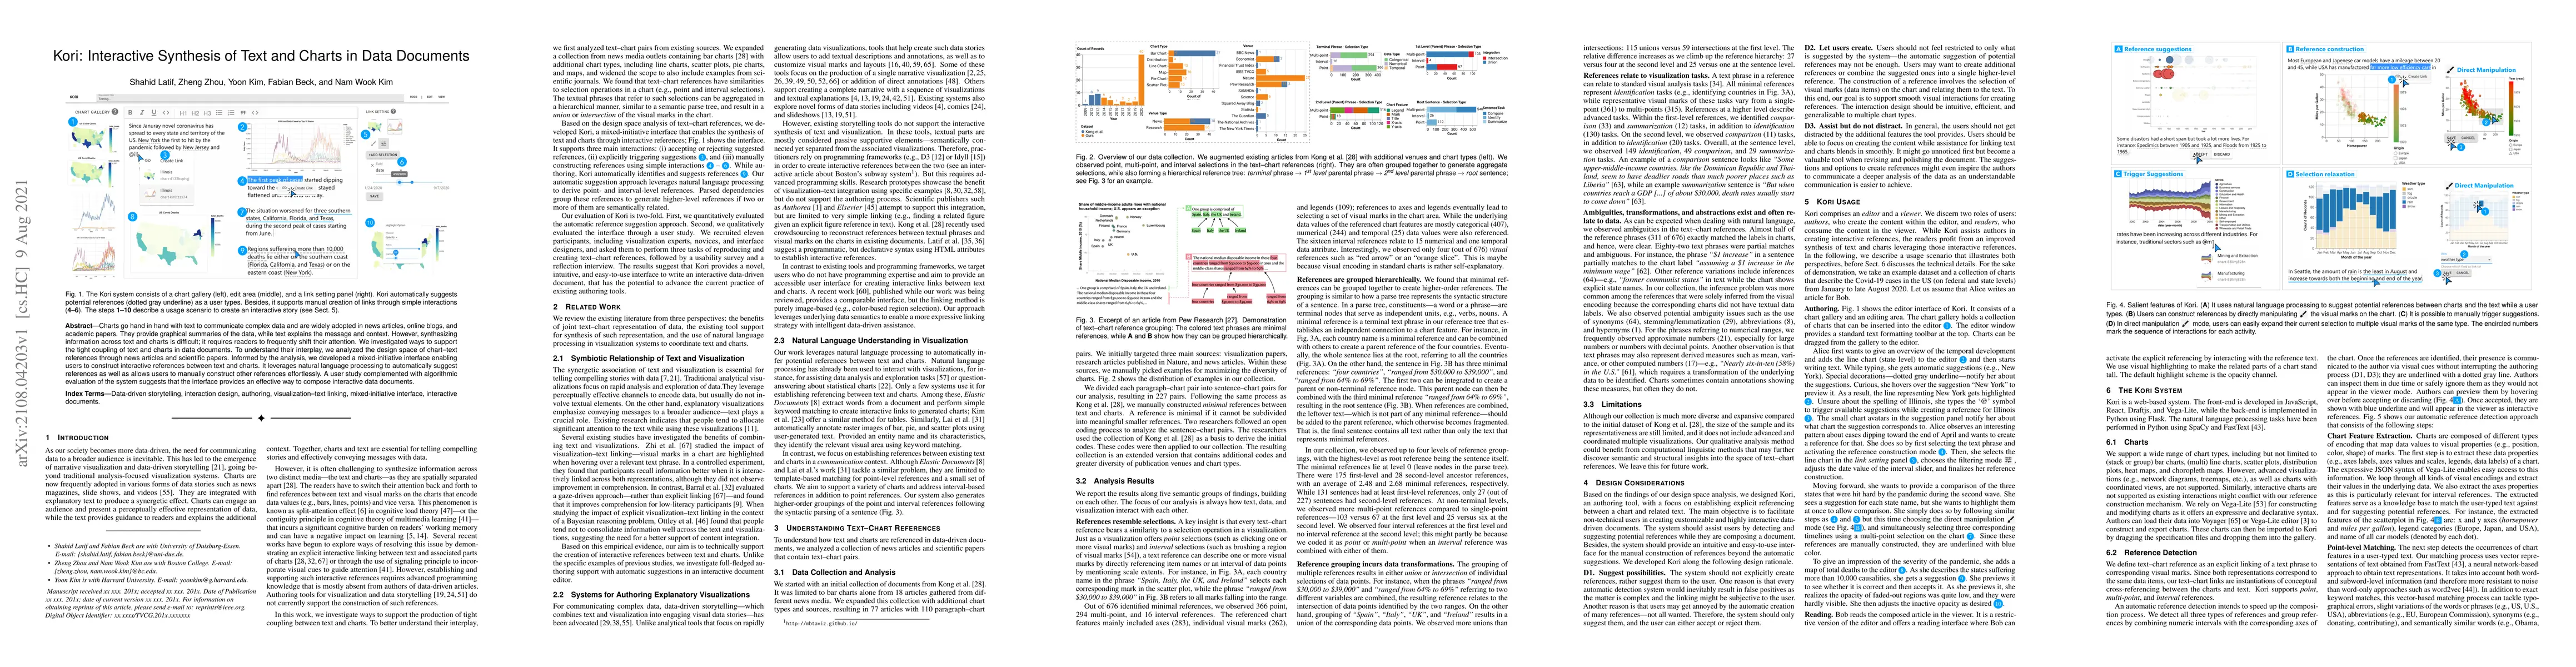
Charts go hand in hand with text to communicate complex data and are widely adopted in news articles, online blogs, and academic papers. They provide graphical summaries of the data, while text explains the message and context. However, synthesizing information across text and charts is difficult; it requires readers to frequently shift their attention. We investigated ways to support the tight coupling of text and charts in data documents. To understand their interplay, we analyzed the design space of chart-text references through news articles and scientific papers. Informed by the analysis, we developed a mixed-initiative interface enabling users to construct interactive references between text and charts. It leverages natural language processing to automatically suggest references as well as allows users to manually construct other references effortlessly. A user study complemented with algorithmic evaluation of the system suggests that the interface provides an effective way to compose interactive data documents.
Get AI-generated insights about this paper's methodology, results, and significance.
Current paper (gray), citations (green), references (blue)
Chen Zhu-Tian, Haijun Xia
Arvind Satyanarayan, Arjun Srinivasan, Vidya Setlur
Title | Authors | Year | Actions |
---|---|---|---|
DATAWEAVER: Authoring Data-Driven Narratives through the Integrated Composition of Visualization and Text
|
Yu Fu, Dennis Bromley, V. Setlur
|
2025
|
View Paper |
Plume: Scaffolding Text Composition in Dashboards
|
Maxim Lisnic, V. Setlur, N. Sultanum
|
2025
|
View Paper |
InterLink: Linking Text with Code and Output in Computational Notebooks
|
Yanna Lin, Leni Yang, Haotian Li, Huamin Qu, Dominik Moritz
|
2025
|
View Paper |
Pluto: Authoring Semantically Aligned Text and Charts for Data-Driven Communication
|
Arjun Srinivasan, V. Setlur, Arvind Satyanarayan
|
2025
|
View Paper |
A Survey on Annotations in Information Visualization: Empirical Insights, Applications, and Challenges
|
Md Dilshadur Rahman, Bhavana Doppalapudi, Ghulam Jilani Quadri, Paul Rosen
|
2024
|
View Paper |
Narrative Player: Reviving Data Narratives with Visuals
|
Zekai Shao, Leixian Shen, Haotian Li, Yi Shan, Huamin Qu, Yun Wang, Siming Chen
|
2024
|
View Paper |
Data Playwright: Authoring Data Videos with Annotated Narration
|
Leixian Shen, Haotian Li, Yun Wang, Tianqi Luo, Yuyu Luo, Huamin Qu
|
2024
|
View Paper |
Natural Language Generation for Visualizations: State of the Art, Challenges and Future Directions
|
Enamul Hoque, Mohammed Saidul Islam
|
2024
|
View Paper |
"The Data Says Otherwise"-Towards Automated Fact-checking and Communication of Data Claims
|
Yu Fu, Shunan Guo, J. Hoffswell, V. S. Bursztyn, R. Rossi, J. Stasko
|
2024
|
View Paper |
Intents, Techniques, and Components: a Unified Analysis of Interaction Authoring Tasks in Data Visualization
|
Hyemi Song, Sai Gopinath, Zhicheng Liu
|
2024
|
View Paper |
A Deixis-Centered Approach for Documenting Remote Synchronous Communication Around Data Visualizations
|
Chang Han, Katherine E. Isaacs
|
2024
|
View Paper |
Dash: A Bimodal Data Exploration Tool for Interactive Text and Visualizations
|
Dennis Bromley, V. Setlur
|
2024
|
View Paper |
“It's a Good Idea to Put It Into Words”: Writing ‘Rudders’ in the Initial Stages of Visualization Design
|
Chase Stokes, Clara Hu, Marti A. Hearst
|
2024
|
View Paper |
From Instruction to Insight: Exploring the Functional and Semantic Roles of Text in Interactive Dashboards
|
N. Sultanum, V. Setlur
|
2024
|
View Paper |
TaskFinder: A Semantics-Based Methodology for Visualization Task Recommendation
|
Darius Coelho, Bhavya Ghai, Arjun Krishna, Maria C. Velez-Rojas, Steve Greenspan, Serge Mankovski, Klaus Mueller
|
2024
|
View Paper |
Enhancing Data Literacy On-demand: LLMs as Guides for Novices in Chart Interpretation.
|
Kiroong Choe, Chaerin Lee, S. Lee, Jiwon Song, Aeri Cho, Nam Wook Kim, Jinwook Seo
|
2024
|
View Paper |
RemixTape: Enriching Narratives about Metrics with Semantic Alignment and Contextual Recommendation
|
Matthew Brehmer, Margaret Drouhard, Arjun Srinivasan
|
2024
|
View Paper |
Save It for the "Hot" Day: An LLM-Empowered Visual Analytics System for Heat Risk Management
|
Haobo Li, Wong Kam-Kwai, Yan Luo, Juntong Chen, Chengzhong Liu, Yaxuan Zhang, Alexis Kai Hon Lau, Huamin Qu, Dongyu Liu
|
2024
|
View Paper |
Generative AI for Visualization: State of the Art and Future Directions
|
Yilin Ye, Jianing Hao, Yihan Hou, Zhan Wang, Shishi Xiao, Yuyu Luo, Wei Zeng
|
2024
|
View Paper |
Epigraphics: Message-Driven Infographics Authoring
|
Tongyu Zhou, Jeff Huang, G. Chan
|
2024
|
View Paper |
DataDive: Supporting Readers' Contextualization of Statistical Statements with Data Exploration
|
Hyunwoo Kim, Khanh-Duy Le, Gionnieve Lim, Dae Hyun Kim, Yoo Jin Hong, Juho Kim
|
2024
|
View Paper |
Telling stories with data - A systematic review
|
Kay Schröder, Wiebke Eberhardt, Poornima Belavadi, B. Ajdadilish, Nanette van Haften, Ed Overes, Taryn Brouns, André Calero Valdez
|
2023
|
View Paper |
Socrates: Data Story Generation via Adaptive Machine-Guided Elicitation of User Feedback
|
Guande Wu, Shunan Guo, J. Hoffswell, G. Chan, R. Rossi, E. Koh
|
2023
|
View Paper |
Where Are We So Far? Understanding Data Storytelling Tools from the Perspective of Human-AI Collaboration
|
Haotian Li, Yun Wang, Huamin Qu
|
2023
|
View Paper |
Show It or Tell It? Text, Visualization, and Their Combination
|
Marti A. Hearst
|
2023
|
View Paper |
Calliope-Net: Automatic Generation of Graph Data Facts via Annotated Node-Link Diagrams
|
Qing Chen, Nan Chen, W. Shuai, Guande Wu, Zhe Xu, H. Tong, Nana Cao
|
2023
|
View Paper |
Data Player: Automatic Generation of Data Videos with Narration-Animation Interplay
|
Leixian Shen, Yizhi Zhang, Haidong Zhang, Yun Wang
|
2023
|
View Paper |
WonderFlow: Narration-Centric Design of Animated Data Videos
|
Yun Wang, Leixian Shen, Zhengxin You, Xinhuan Shu, Bongshin Lee, John Thompson, Haidong Zhang, Dongmei Zhang
|
2023
|
View Paper |
DATATALES: Investigating the use of Large Language Models for Authoring Data-Driven Articles
|
N. Sultanum, Arjun Srinivasan
|
2023
|
View Paper |
What Is the Difference Between a Mountain and a Molehill? Quantifying Semantic Labeling of Visual Features in Line Charts
|
Dennis Bromley, V. Setlur
|
2023
|
View Paper |
EC: A Tool for Guiding Chart and Caption Emphasis
|
Dae Hyun Kim, Seulgi Choi, Juho Kim, V. Setlur, Maneesh Agrawala
|
2023
|
View Paper |
InkSight: Leveraging Sketch Interaction for Documenting Chart Findings in Computational Notebooks
|
Yanna Lin, Haotian Li, Leni Yang, Aoyu Wu, Huamin Qu
|
2023
|
View Paper |
Making Data-Driven Articles more Accessible: An Active Preference Learning Approach to Data Fact Personalization
|
Yanan Wang, Yea-Seul Kim
|
2023
|
View Paper |
Toward a Scalable Census of Dashboard Designs in the Wild: A Case Study with Tableau Public
|
Joanna Purich, Arjun Srinivasan, M. Correll, L. Battle, V. Setlur, Anamaria Crisan
|
2023
|
View Paper |
VisText: A Benchmark for Semantically Rich Chart Captioning
|
Benny J. Tang, Angie Boggust
|
2023
|
View Paper |
The State of the Art in Creating Visualization Corpora for Automated Chart Analysis
|
Chen Chen, Zhicheng Liu
|
2023
|
View Paper |
DataParticles: Block-based and Language-oriented Authoring of Animated Unit Visualizations
|
Yining Cao, J. E, Zhutian Chen, Haijun Xia
|
2023
|
View Paper |
Charagraph: Interactive Generation of Charts for Realtime Annotation of Data-Rich Paragraphs
|
Damien Masson, Sylvain Malacria, Géry Casiez, Daniel Vogel
|
2023
|
View Paper |
GraphDescriptor: Augmenting Node-Link Diagrams With Textual Descriptions
|
Jiacheng Pan, Zihan Yan, Zihan Zhou, Xiaodong Zhao, Shenghui Cheng, Dongming Han, Jian Chen, Mingliang Xu, Wei Chen
|
2023
|
View Paper |
The Semantic Reader Project: Augmenting Scholarly Documents through AI-Powered Interactive Reading Interfaces
|
Kyle Lo, Joseph Chee Chang, Andrew Head, Jonathan Bragg, Amy X. Zhang, Cassidy Trier, Chloe Anastasiades, Tal August, Russell Authur, Danielle Bragg, Erin Bransom, Isabel Cachola, Stefan Candra, Yoganand Chandrasekhar, Yen-Sung Chen, Evie (Yu-Yen) Cheng, Yvonne Chou, Doug Downey, Rob Evans, Raymond Fok, F.Q. Hu, Regan Huff, Dongyeop Kang, Tae Soo Kim, Rodney Michael Kinney, A. Kittur, Hyeonsu B Kang, Egor Klevak, Bailey Kuehl, Michael Langan, Matt Latzke, Jaron Lochner, Kelsey MacMillan, Eric Stuart Marsh, Tyler C. Murray, Aakanksha Naik, Ngoc-Uyen Nguyen, Srishti Palani, Soya Park, Caroline Paulic, Napol Rachatasumrit, Smita R Rao, Paul Sayre, Zejiang Shen, Pao Siangliulue, Luca Soldaini, Huy Tran, Madeleine van Zuylen, Lucy Lu Wang, Christopher Wilhelm, Caroline M Wu, Jiangjiang Yang, Angele Zamarron, Marti A. Hearst, Daniel S. Weld
|
2023
|
View Paper |
An intelligent approach to automatically discovering visual insights
|
Yuhua Zhou, Xiyu Meng, Yanhong Wu, Tan Tang, Yongheng Wang, Yingcai Wu
|
2022
|
View Paper |
Intentable: A Mixed-Initiative System for Intent-Based Chart Captioning
|
Ji-Won Choi, Jaemin Jo
|
2022
|
View Paper |
Striking a Balance: Reader Takeaways and Preferences when Integrating Text and Charts
|
Chase Stokes, V. Setlur, Bridget Cogley, Arvind Satyanarayan, Marti A. Hearst
|
2022
|
View Paper |
How Does Automation Shape the Process of Narrative Visualization: A Survey of Tools
|
Qing Chen, Shixiong Cao, Jiazhe Wang, Nan Cao
|
2022
|
View Paper |
Investigating the Role and Interplay of Narrations and Animations in Data Videos
|
Hao Cheng, Junhong Wang, Yun Wang, Bongshin Lee, Haidong Zhang, Dongmei Zhang
|
2022
|
View Paper |
Math Augmentation: How Authors Enhance the Readability of Formulas using Novel Visual Design Practices
|
Andrew Head, Amber Xie, Marti A. Hearst
|
2022
|
View Paper |
CrossData: Leveraging Text-Data Connections for Authoring Data Documents
|
Zhutian Chen, Haijun Xia
|
2022
|
View Paper |
A Pilot Study Comparing ChatGPT and Google Search in Supporting Visualization Insight Discovery
|
Chen He, Robin Welsch, Giulio Jacucci
|
2024
|
View Paper |
ORD-Xplore: Bridging Open Research Data Collections through Modality Abstractions
|
S. Lenti, M. Sachdeva, M. Blum, Y. Stricker, Tobias Schreck, R. Mumenthaler, J. Bernard
|
2023
|
View Paper |
Application of Virtual Reality Technology in the Design of Interactive Interfaces for Public Service Announcements
|
Rong Hu
|
2023
|
View Paper |
CODAS: Integrating Business Analytics and Report Authoring
|
Z. Zhang, S. Malik, S. Guo, J. Hoffswell, R. Rossi, F. Du, E. Koh
|
2022
|
View Paper |
Understanding Business Analysts' Needs for Data Report Authoring
|
Z. Zhang, S. Malik, S. Guo, J. Hoffswell, R. Rossi, F. Du, E. Koh
|
2022
|
View Paper |
The Why and The How: A Survey on Natural Language Interaction in Visualization
|
Henrik Voigt, Ozge Alacam, M. Meuschke, K. Lawonn, Sina Zarrieß
|
2022
|
View Paper |
Comments (0)