Chronoblox: Chronophotographic Sequential Graph Visualization
Publication
Metrics
AI Quick Summary
Chronoblox visualizes dynamic graphs through chronophotography, embedding all snapshots into a common space to reveal both local and global structural evolutions. The method is evaluated using synthetic and real-world retweet networks.
Paper Preview
Abstract
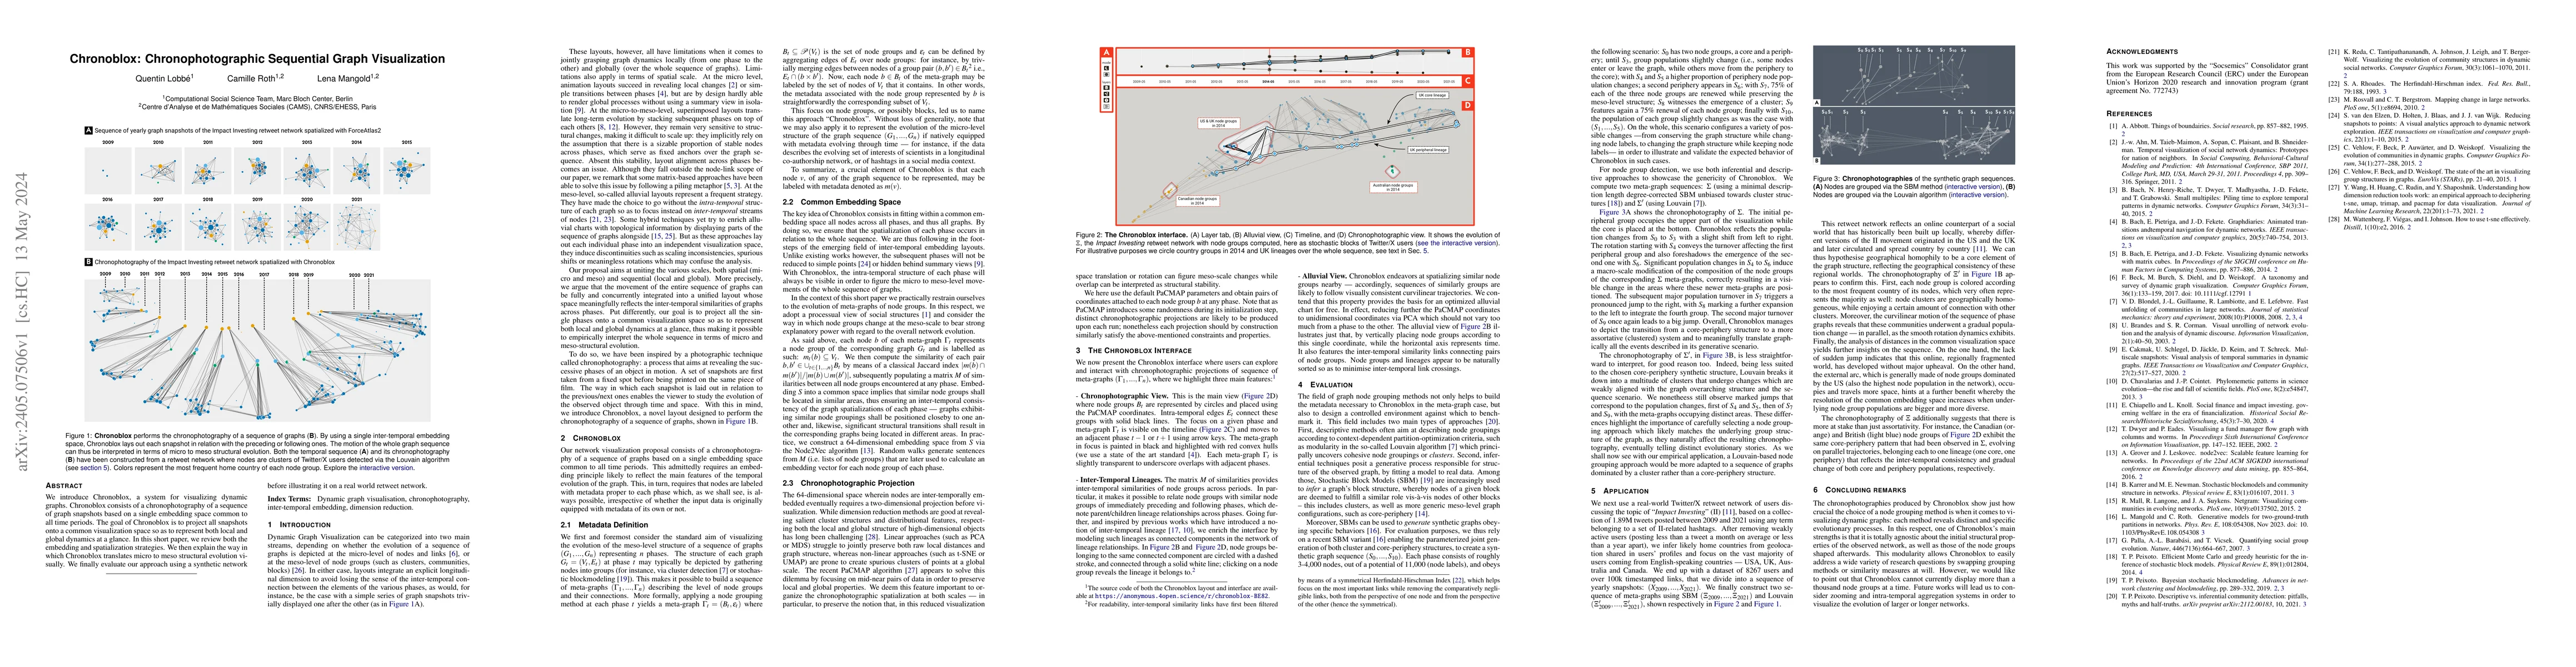
We introduce Chronoblox, a system for visualizing dynamic graphs. Chronoblox consists of a chronophotography of a sequence of graph snapshots based on a single embedding space common to all time periods. The goal of Chronoblox is to project all snapshots onto a common visualization space so as to represent both local and global dynamics at a glance. In this short paper, we review both the embedding and spatialization strategies. We then explain the way in which Chronoblox translates micro to meso structural evolution visually. We finally evaluate our approach using a synthetic network before illustrating it on a real world retweet network.
AI Key Findings
Get AI-generated insights about this paper's methodology, results, significance, and more — seven facets brought into focus.
Impact
Paper Details
Authors
PDF Preview
Key Terms
Citation Network
Current paper (gray), citations (green), references (blue)
Display is limited for performance on very large graphs.
Discussion 0