Publication
Metrics
AI Quick Summary
This paper introduces a novel model that jointly performs classification and regression for chart question answering, utilizing co-attention transformers to better capture interactions between text and visual elements. The proposed approach outperforms existing models on the PlotQA dataset and shows competitive results on FigureQA, especially for questions requiring regression.
Paper Preview
Abstract
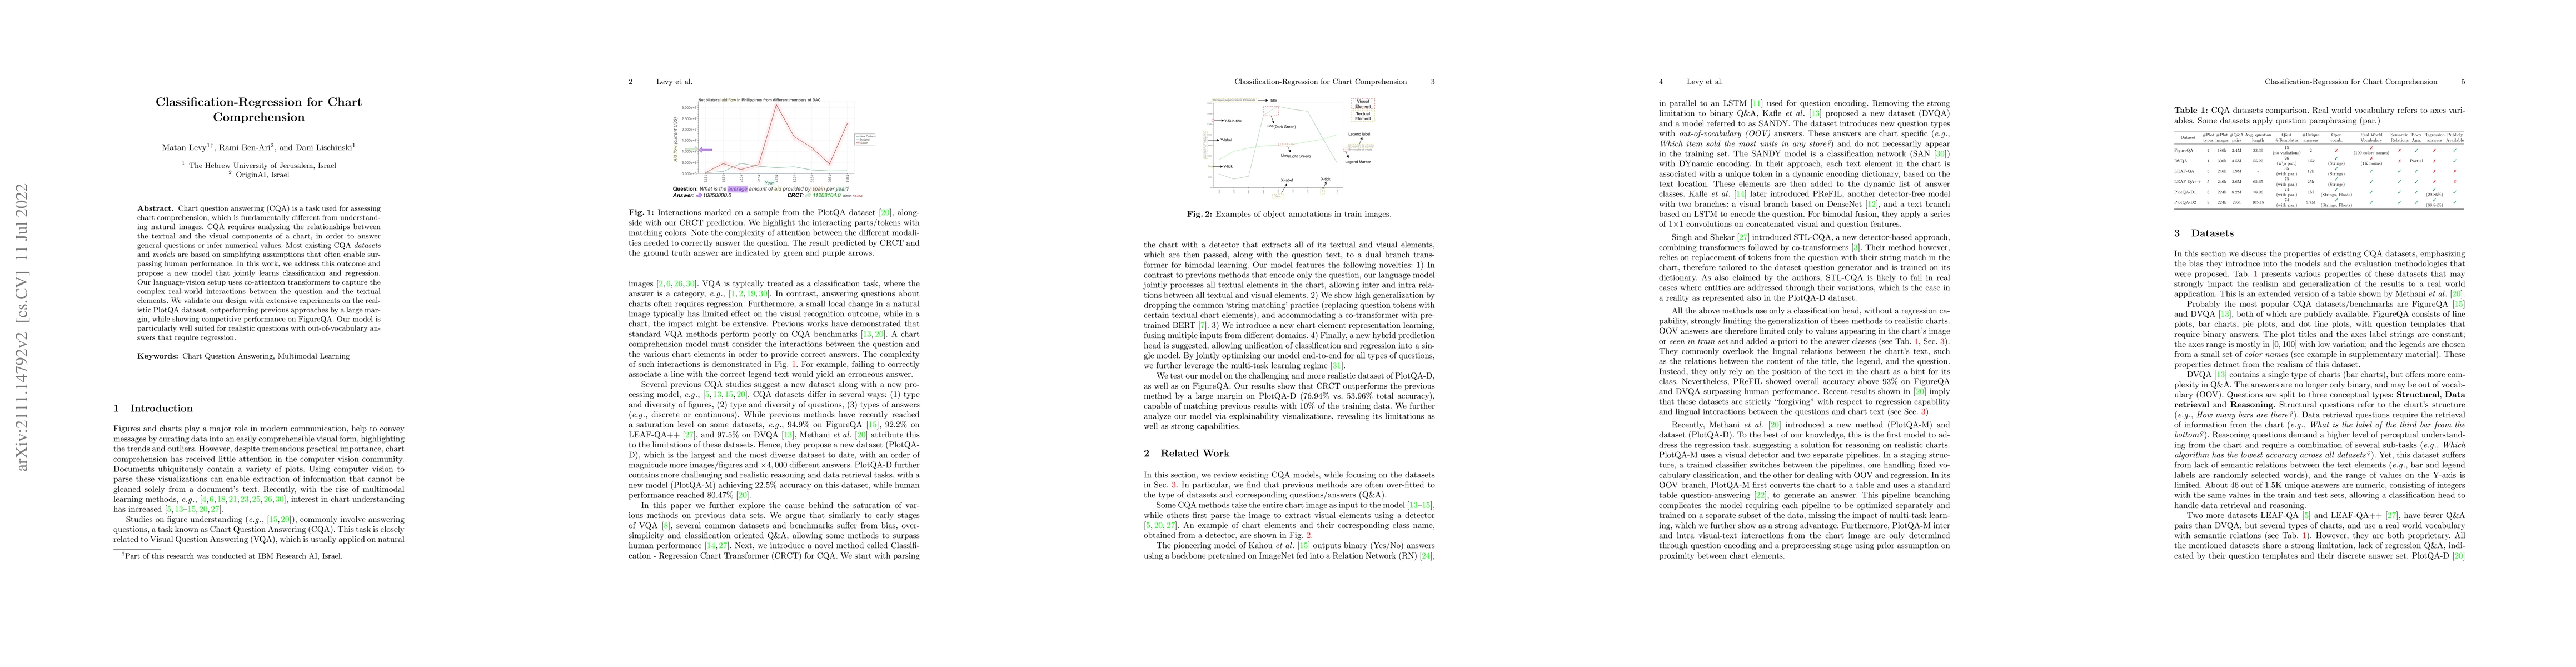
Chart question answering (CQA) is a task used for assessing chart comprehension, which is fundamentally different from understanding natural images. CQA requires analyzing the relationships between the textual and the visual components of a chart, in order to answer general questions or infer numerical values. Most existing CQA datasets and models are based on simplifying assumptions that often enable surpassing human performance. In this work, we address this outcome and propose a new model that jointly learns classification and regression. Our language-vision setup uses co-attention transformers to capture the complex real-world interactions between the question and the textual elements. We validate our design with extensive experiments on the realistic PlotQA dataset, outperforming previous approaches by a large margin, while showing competitive performance on FigureQA. Our model is particularly well suited for realistic questions with out-of-vocabulary answers that require regression.
AI Key Findings
Get AI-generated insights about this paper's methodology, results, significance, and more — seven facets brought into focus.
Impact
Paper Details
Authors
PDF Preview
Key Terms
Citation Network
Current paper (gray), citations (green), references (blue)
Display is limited for performance on very large graphs.
Discussion 0