Publication
Metrics
AI Quick Summary
Novice learners benefit from visualization analogies that map data structures to real-world contexts, improving visual analysis skills and preference over traditional chart visualizations.
Paper Preview
Abstract
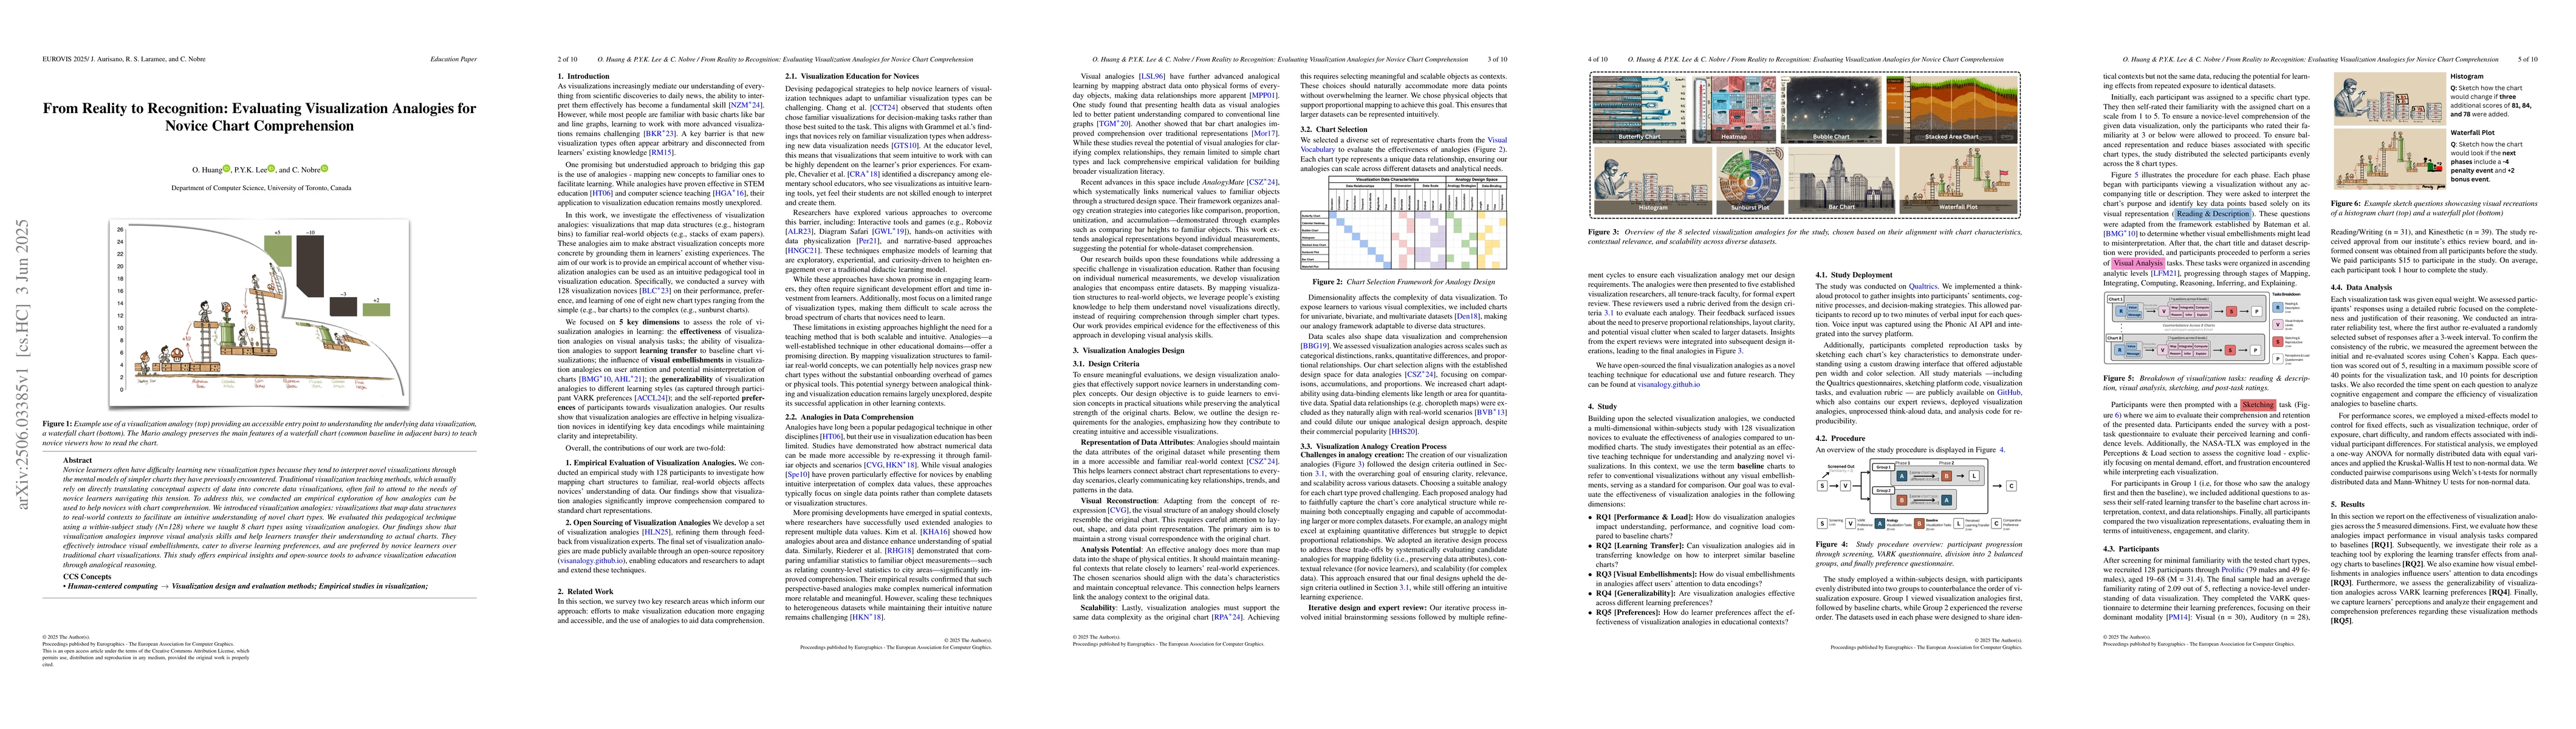
Novice learners often have difficulty learning new visualization types because they tend to interpret novel visualizations through the mental models of simpler charts they have previously encountered. Traditional visualization teaching methods, which usually rely on directly translating conceptual aspects of data into concrete data visualizations, often fail to attend to the needs of novice learners navigating this tension. To address this, we conducted an empirical exploration of how analogies can be used to help novices with chart comprehension. We introduced visualization analogies: visualizations that map data structures to real-world contexts to facilitate an intuitive understanding of novel chart types. We evaluated this pedagogical technique using a within-subject study (N=128) where we taught 8 chart types using visualization analogies. Our findings show that visualization analogies improve visual analysis skills and help learners transfer their understanding to actual charts. They effectively introduce visual embellishments, cater to diverse learning preferences, and are preferred by novice learners over traditional chart visualizations. This study offers empirical insights and open-source tools to advance visualization education through analogical reasoning.
AI Key Findings
Get AI-generated insights about this paper's methodology, results, significance, and more — seven facets brought into focus.
Authors
PDF Preview
Related Papers
No references found for this paper.
Discussion 0