Clustering Multivariate Time Series using Energy Distance
Publication
Metrics
AI Quick Summary
This paper proposes a novel clustering method for multivariate time series based on energy distance, creating a dissimilarity matrix for separation measurement without model assumptions. The method is validated through simulations and applied to real datasets like GDP and population data.
Paper Preview
Abstract
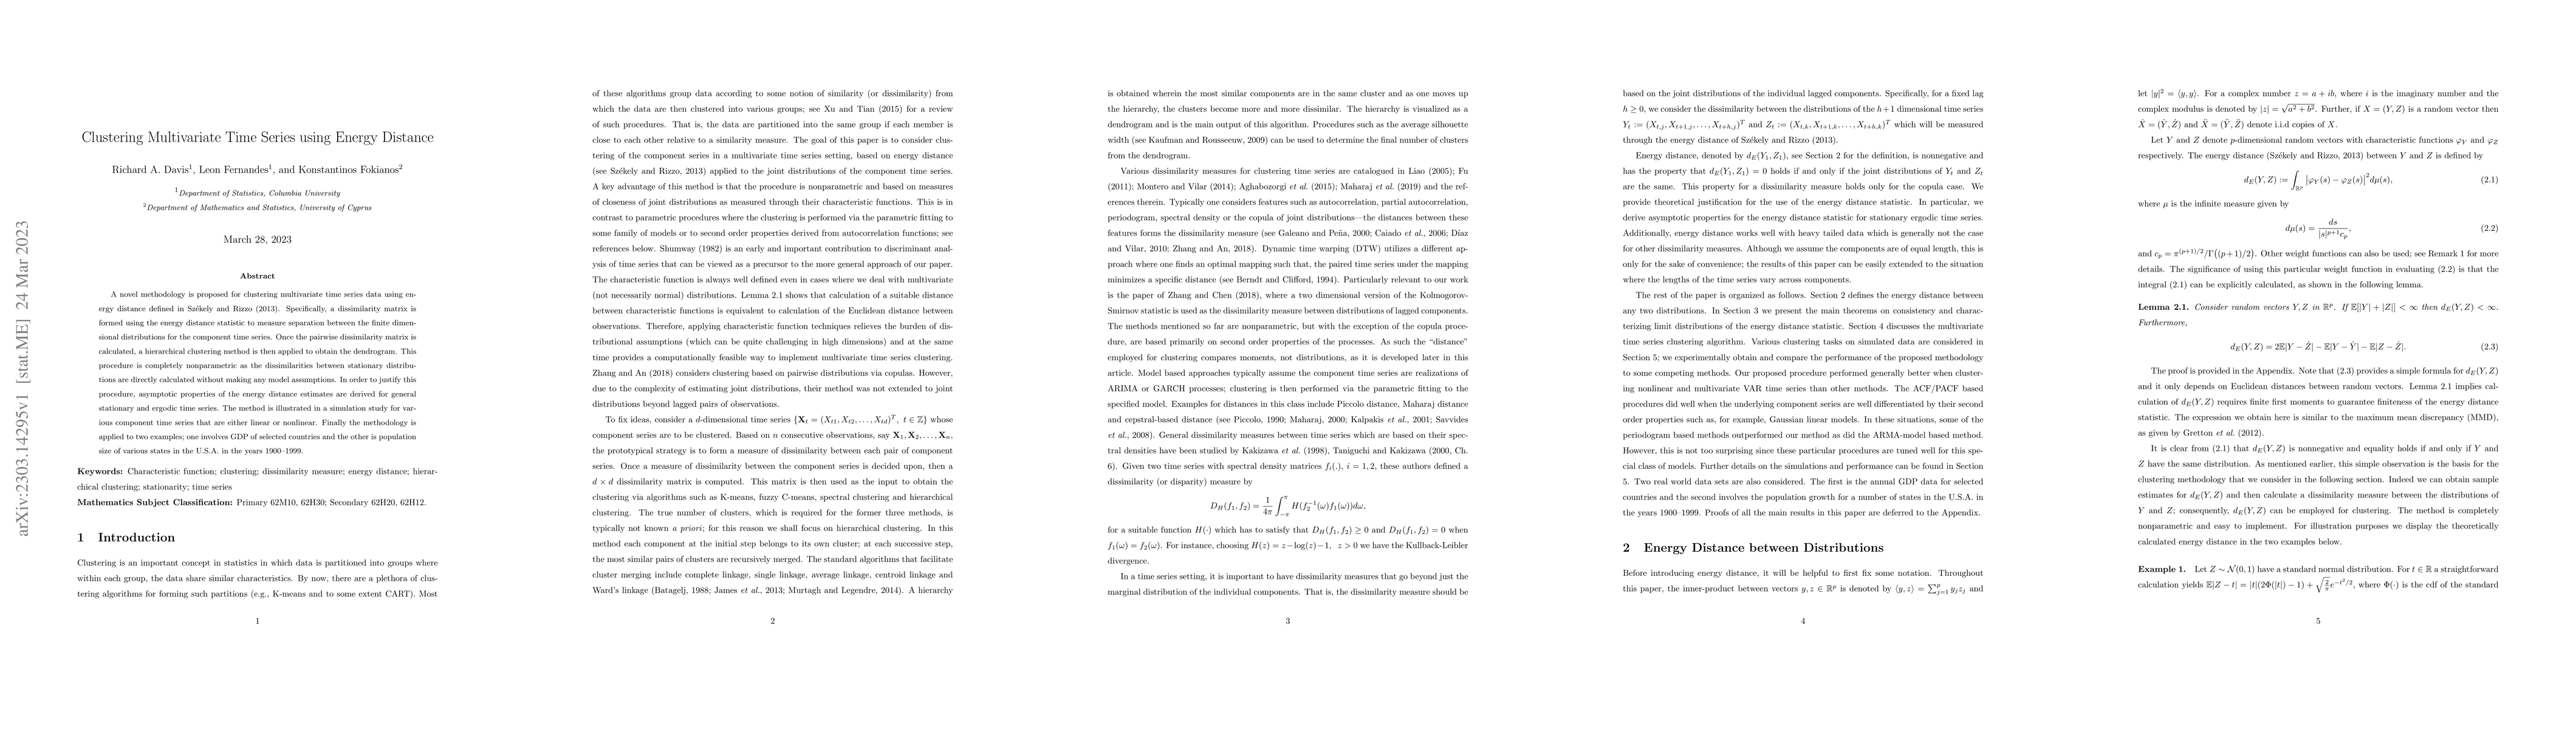
A novel methodology is proposed for clustering multivariate time series data using energy distance defined in Sz\'ekely and Rizzo (2013). Specifically, a dissimilarity matrix is formed using the energy distance statistic to measure separation between the finite dimensional distributions for the component time series. Once the pairwise dissimilarity matrix is calculated, a hierarchical clustering method is then applied to obtain the dendrogram. This procedure is completely nonparametric as the dissimilarities between stationary distributions are directly calculated without making any model assumptions. In order to justify this procedure, asymptotic properties of the energy distance estimates are derived for general stationary and ergodic time series. The method is illustrated in a simulation study for various component time series that are either linear or nonlinear. Finally the methodology is applied to two examples; one involves GDP of selected countries and the other is population size of various states in the U.S.A. in the years 1900 -1999.
AI Key Findings
Get AI-generated insights about this paper's methodology, results, significance, and more — seven facets brought into focus.
Impact
Paper Details
Authors
PDF Preview
Key Terms
Citation Network
Current paper (gray), citations (green), references (blue)
Display is limited for performance on very large graphs.
Discussion 0