Publication
Metrics
AI Quick Summary
This study investigates how people specify data visualizations using natural language, collecting utterances from 102 participants for ten visualizations. The resulting corpus can evaluate current NLIs and inform the development of new systems for generating visualizations from natural language.
Paper Preview
Abstract
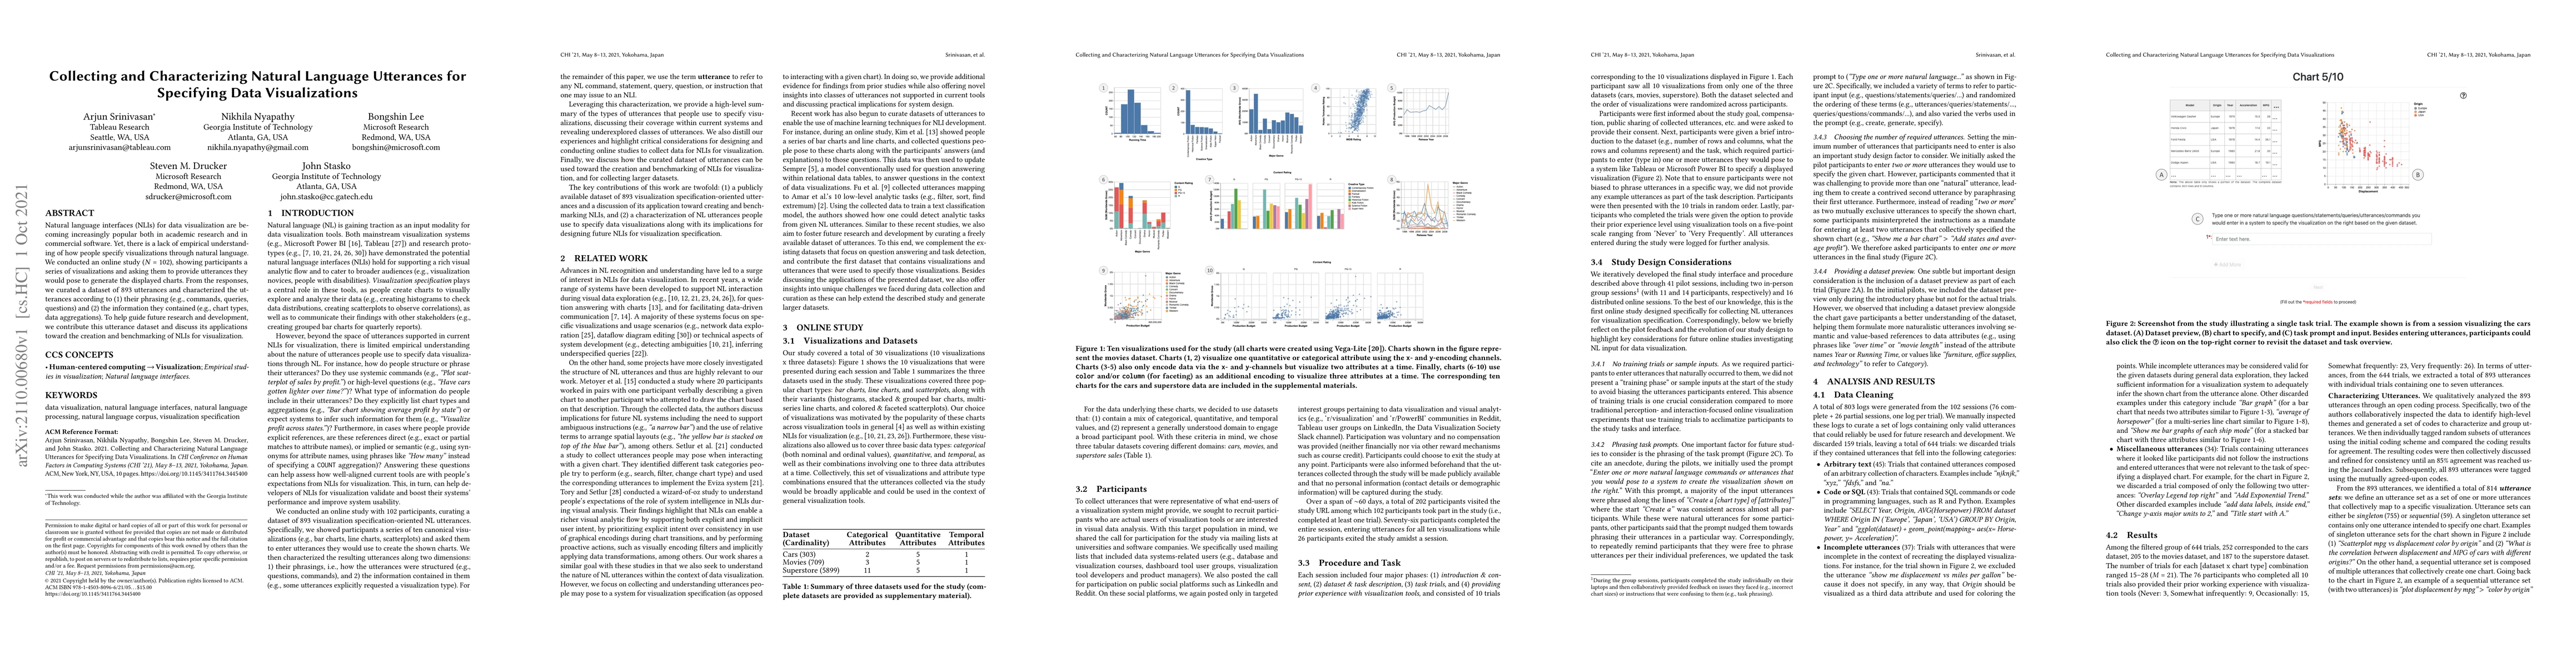
Natural language interfaces (NLIs) for data visualization are becoming increasingly popular both in academic research and in commercial software. Yet, there is a lack of empirical understanding of how people specify visualizations through natural language. To bridge this gap, we conducted an online study with 102 participants. We showed participants a series of ten visualizations for a given dataset and asked them to provide utterances they would pose to generate the displayed charts. The curated list of utterances generated from the study is provided below. This corpus of utterances can be used to evaluate existing NLIs for data visualization as well as for creating new systems and models to generate visualizations from natural language utterances.
AI Key Findings
Get AI-generated insights about this paper's methodology, results, significance, and more — seven facets brought into focus.
Impact
Paper Details
Authors
PDF Preview
Key Terms
Citation Network
Current paper (gray), citations (green), references (blue)
Display is limited for performance on very large graphs.
Discussion 0