Summary
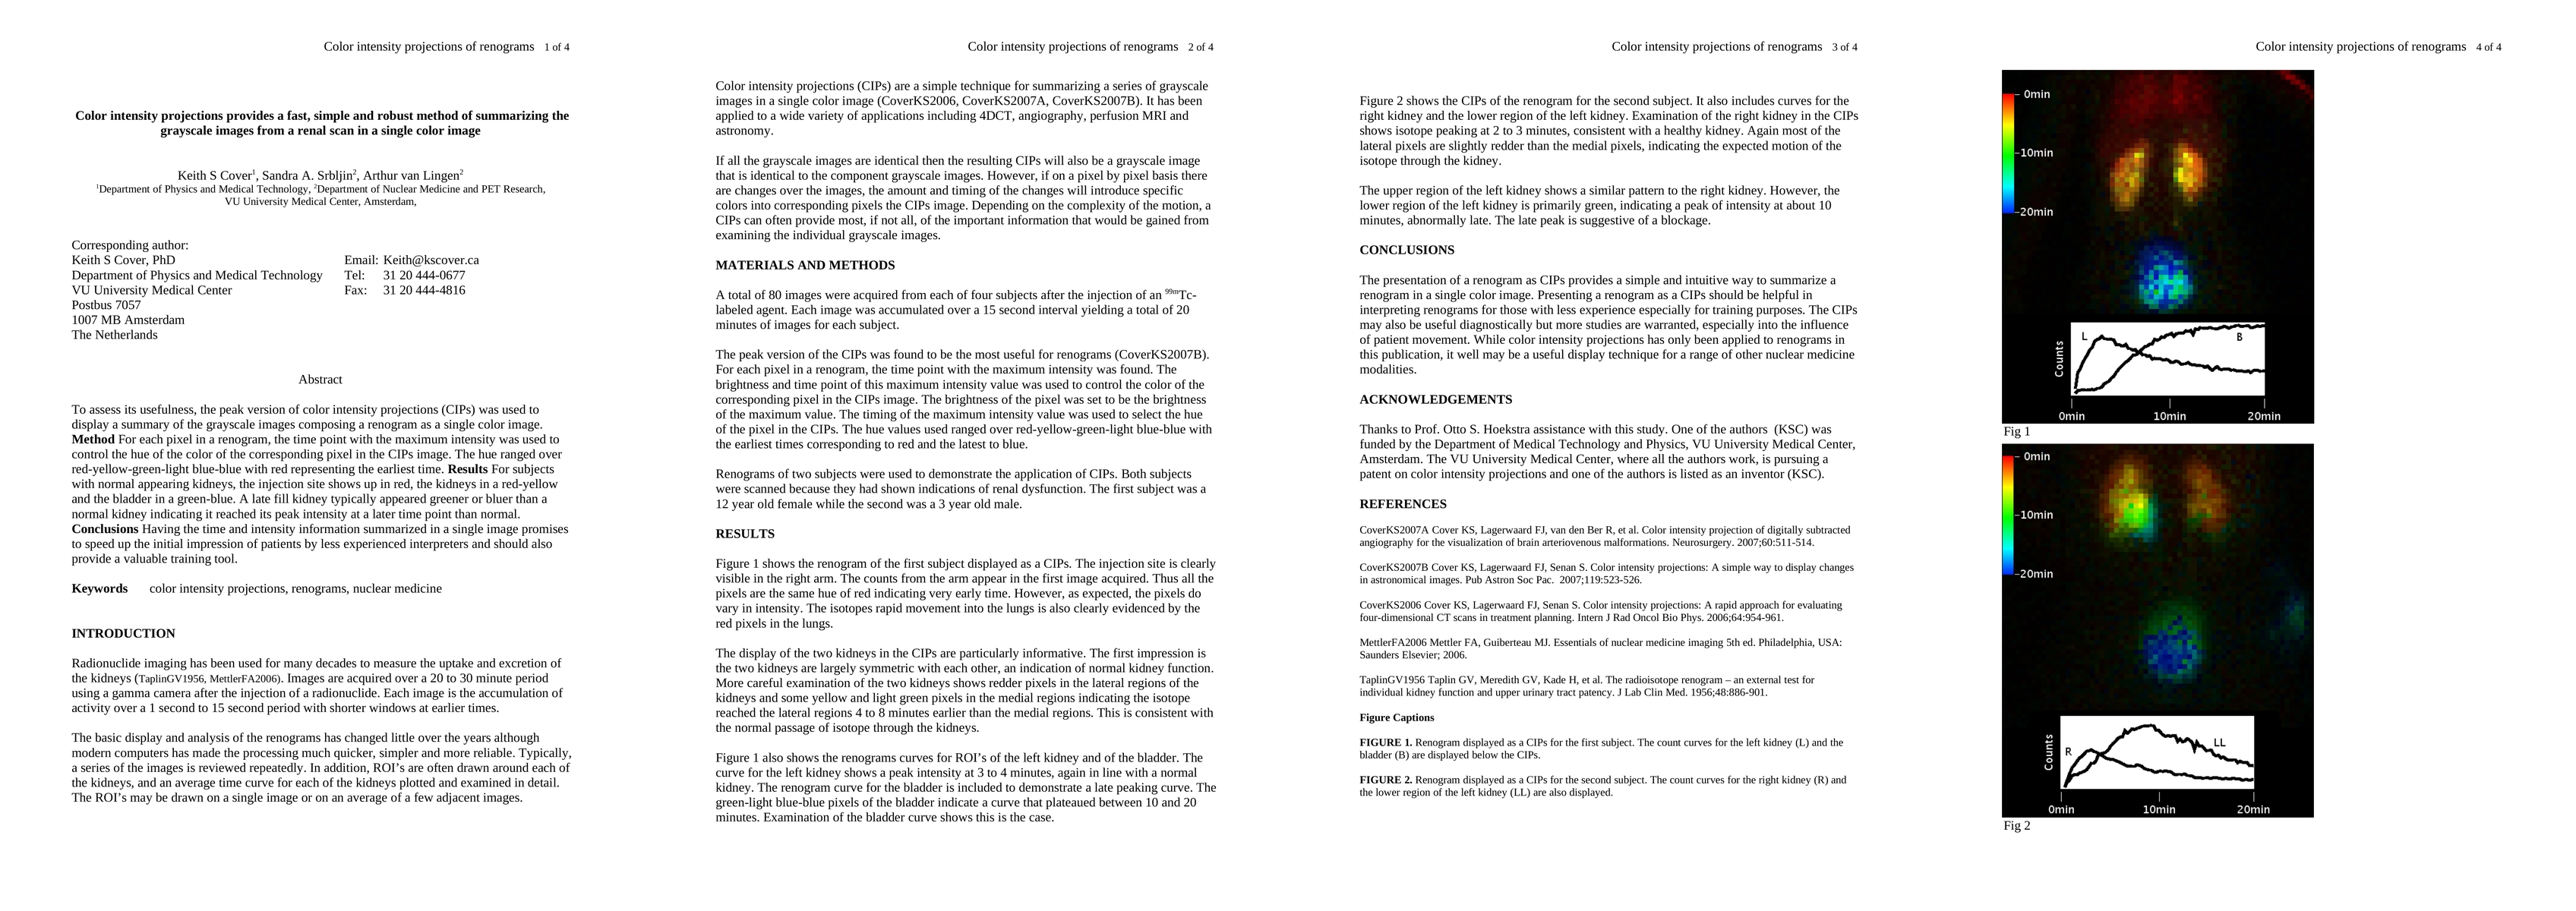
To assess its usefulness, the peak version of color intensity projections (CIPs) was used to display a summary of the grayscale images composing a renogram as a single color image. Method For each pixel in a renogram, the time point with the maximum intensity was used to control the hue of the color of the corresponding pixel in the CIPs image. The hue ranged over red-yellow-green-light blue-blue with red representing the earliest time. Results For subjects with normal appearing kidneys, the injection site shows up in red, the kidneys in a red-yellow and the bladder in a green-blue. A late fill kidney typically appeared greener or bluer than a normal kidney indicating it reached its peak intensity at a later time point than normal. Conclusions Having the time and intensity information summarized in a single image promises to speed up the initial impression of patients by less experienced interpreters and should also provide a valuable training tool.
AI Key Findings
Get AI-generated insights about this paper's methodology, results, and significance.
Paper Details
PDF Preview
Key Terms
Citation Network
Current paper (gray), citations (green), references (blue)
Display is limited for performance on very large graphs.
Similar Papers
Found 4 papersNo citations found for this paper.
Comments (0)