Summary
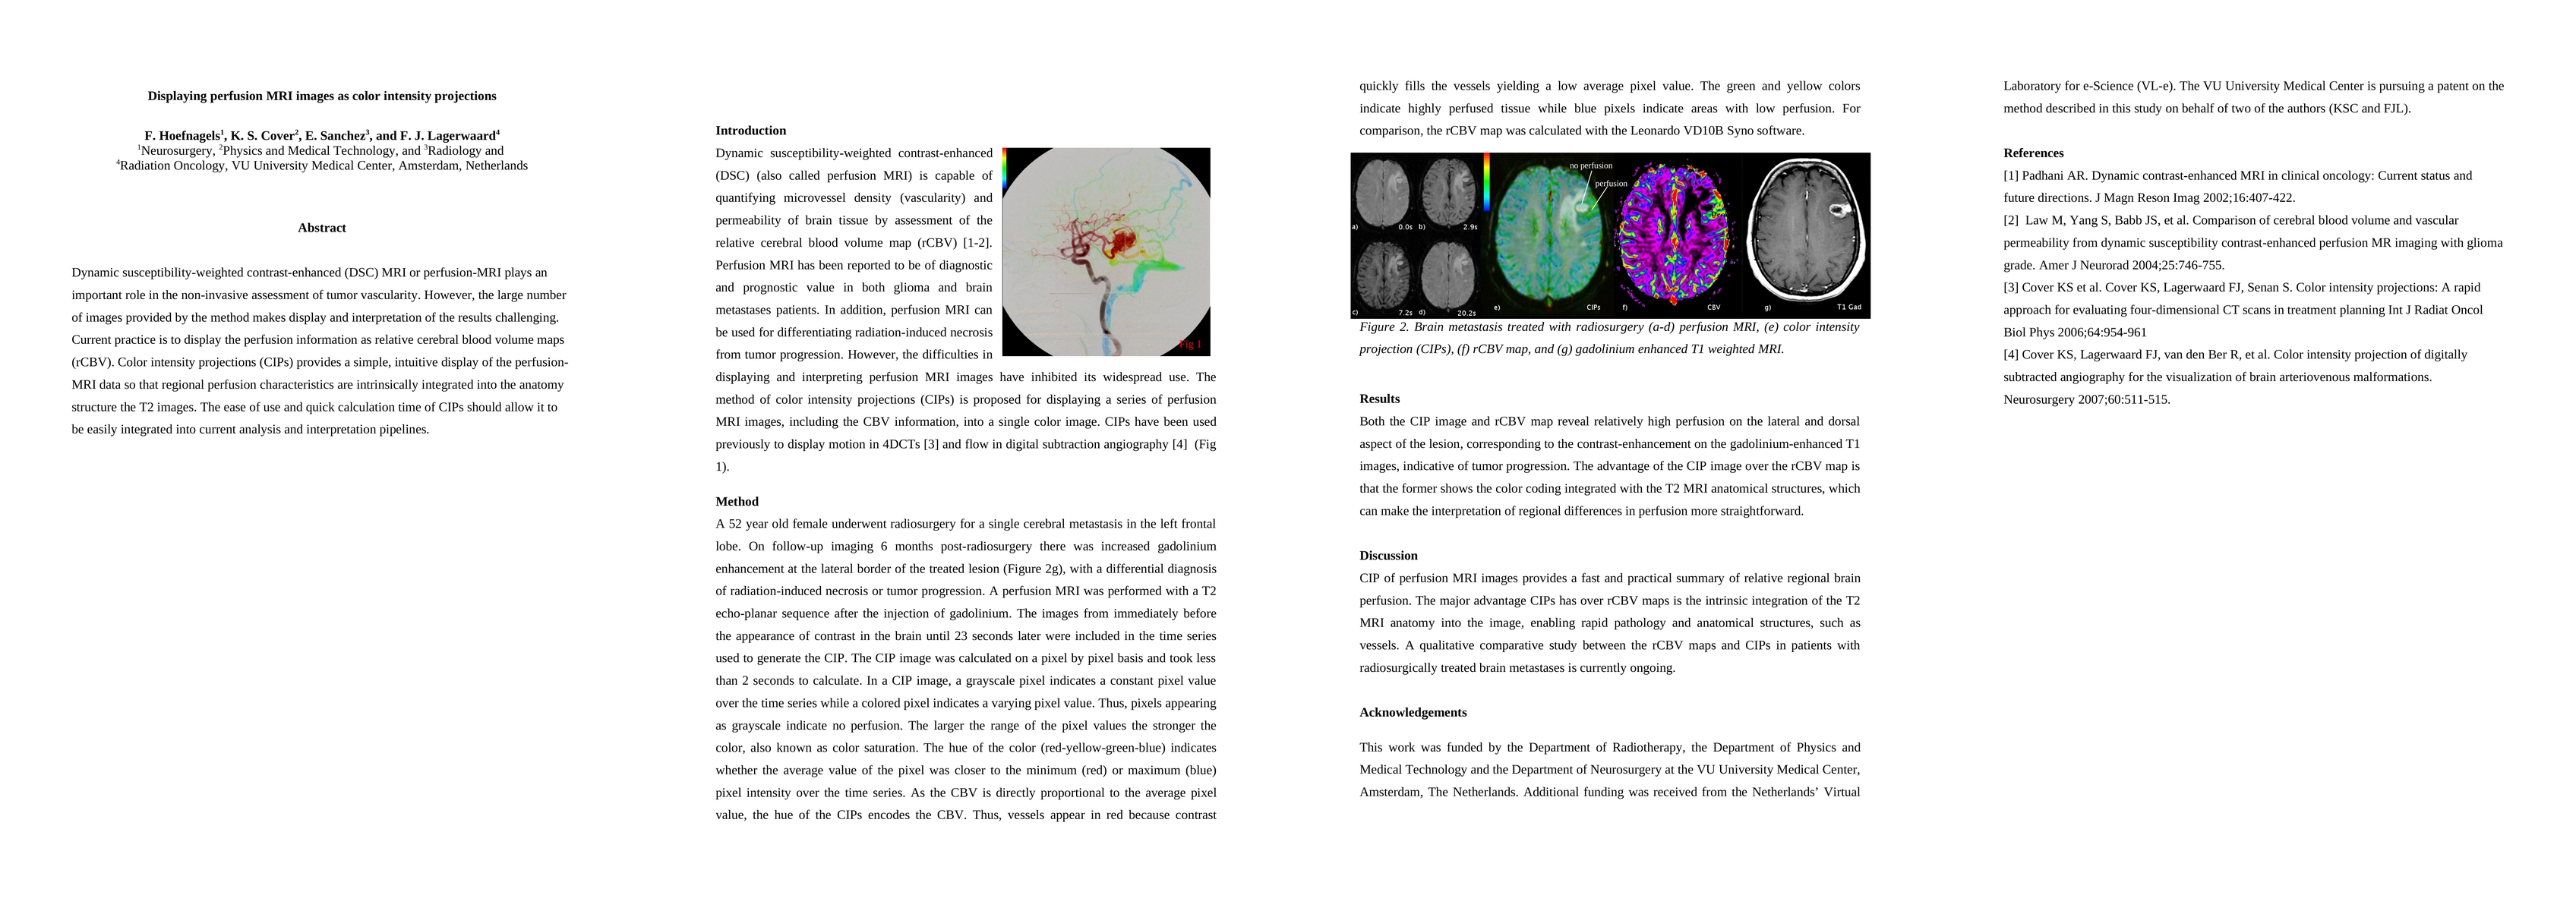
Dynamic susceptibility-weighted contrast-enhanced (DSC) MRI or perfusion-MRI plays an important role in the non-invasive assessment of tumor vascularity. However, the large number of images provided by the method makes display and interpretation of the results challenging. Current practice is to display the perfusion information as relative cerebral blood volume maps (rCBV). Color intensity projections (CIPs) provides a simple, intuitive display of the perfusion-MRI data so that regional perfusion characteristics are intrinsically integrated into the anatomy structure the T2 images. The ease of use and quick calculation time of CIPs should allow it to be easily integrated into current analysis and interpretation pipelines.
AI Key Findings
Get AI-generated insights about this paper's methodology, results, and significance.
Paper Details
PDF Preview
Key Terms
Citation Network
Current paper (gray), citations (green), references (blue)
Display is limited for performance on very large graphs.
Similar Papers
Found 4 papersNo citations found for this paper.

Comments (0)