01
MethodologyHow they did it
The research used a stochastic geometry technique to embed S&P500 yearly batches of data in subspace for analysis.
This paper uses stochastic geometry to analyze the S&P500 index's structure over 30 years, revealing a reduced dimensional subspace with inherent market structure. It explores how extreme events during crises like 1987 and 2001 impact market geometry, observing that sector-specific clustering may weaken during crises, with the market's ellipsoid shape expanding unevenly in 2001.
This paper uses stochastic geometry to analyze the S&P500 index's structure over 30 years, revealing a reduced dimensional subspace with inherent market structure. It explores how extreme events during crises like 1987 and 2001 impact market geometry, observing that sector-specific clustering may weaken during crises, with the market's ellipsoid shape expanding unevenly in 2001.
The research used a stochastic geometry technique to embed S&P500 yearly batches of data in subspace for analysis. More in Methodology →
The study found that collective behavior during crises reinforces the structure of correlations between stocks. — Changes in market volume and shape were analyzed using new measures defined in the space of stocks. More in Key Results →
This research is important as it identifies changes in the structure of the market over the last 30 years. More in Significance →
The study's results may be limited to the S&P500 index and not representative of other markets. — The methodology used may not capture all aspects of market behavior. More in Limitations →
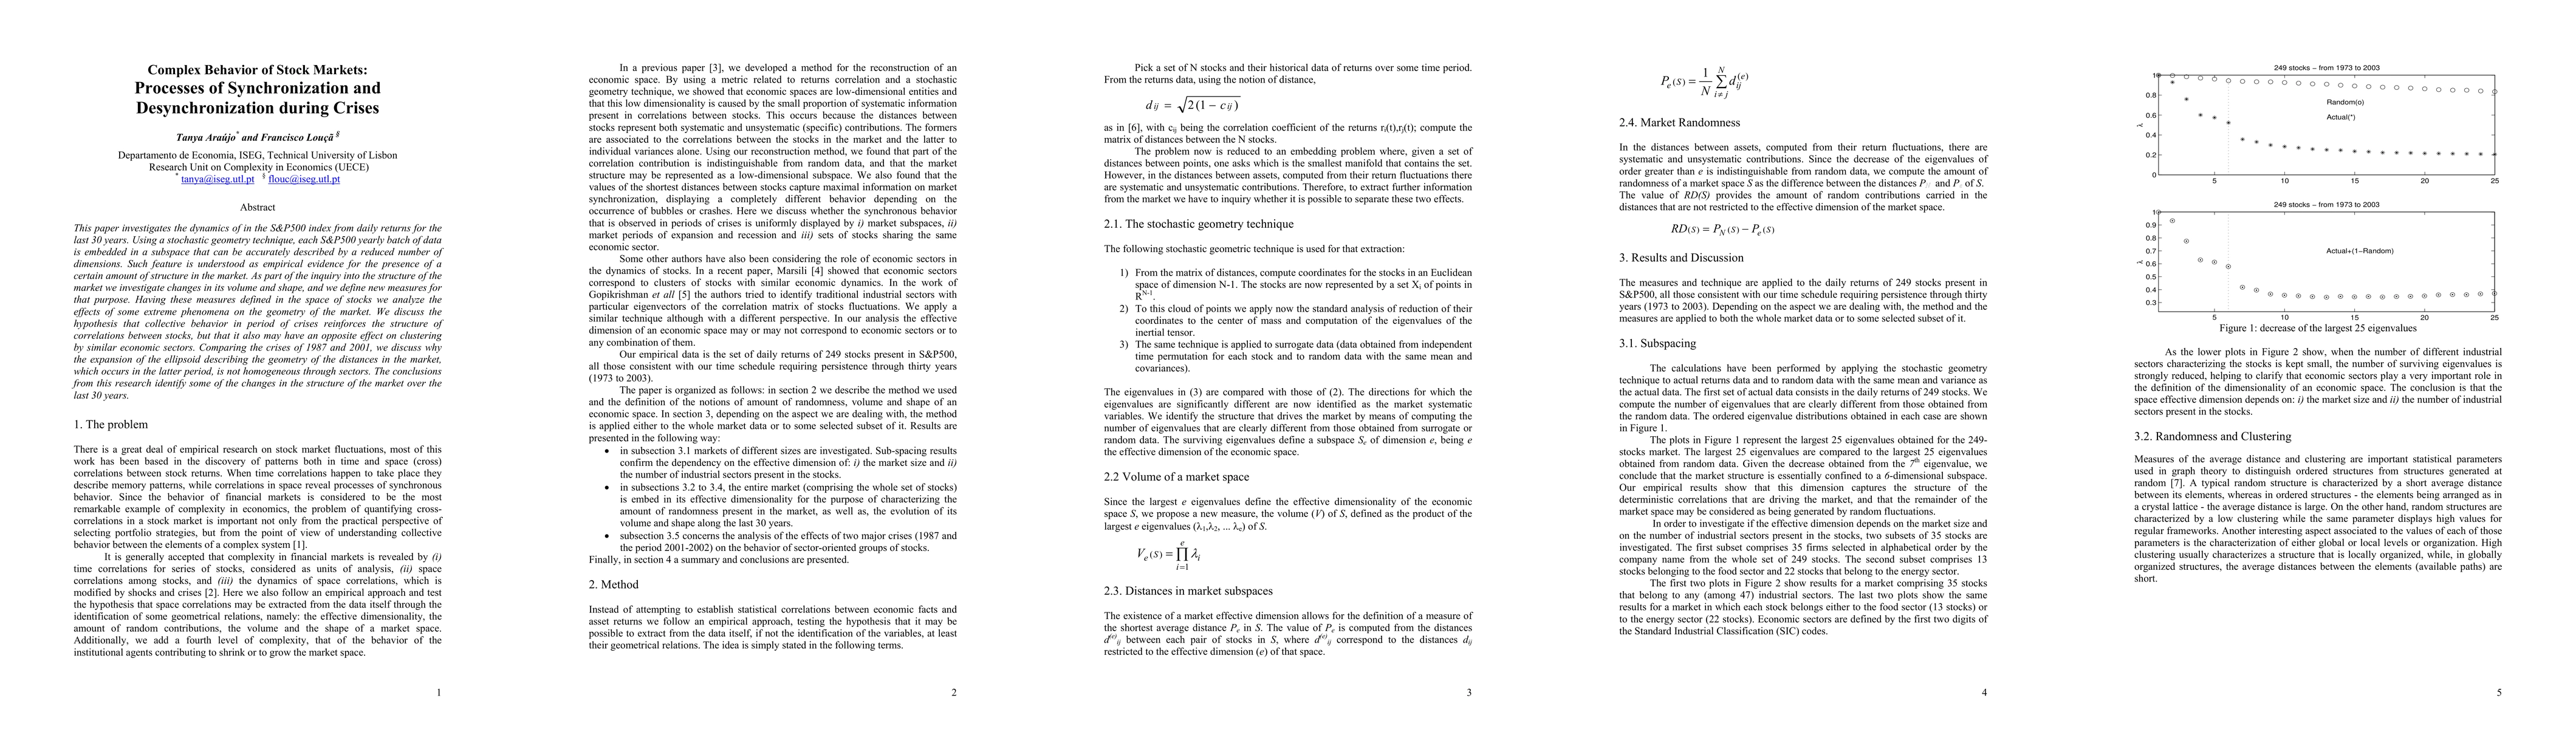
This paper investigates the dynamics of in the S&P500 index from daily returns for the last 30 years. Using a stochastic geometry technique, each S&P500 yearly batch of data is embedded in a subspace that can be accurately described by a reduced number of dimensions. Such feature is understood as empirical evidence for the presence of a certain amount of structure in the market. As part of the inquiry into the structure of the market we investigate changes in its volume and shape, and we define new measures for that purpose. Having these measures defined in the space of stocks we analyze the effects of some extreme phenomena on the geometry of the market. We discuss the hypothesis that collective behavior in period of crises reinforces the structure of correlations between stocks, but that it also may have an opposite effect on clustering by similar economic sectors. Comparing the crises of 1987 and 2001, we discuss why the expansion of the ellipsoid describing the geometry of the distances in the market, which occurs in the latter period, is not homogeneous through sectors. The conclusions from this research identify some of the changes in the structure of the market over the last 30 years.
Seven facets of this paper, analysed and brought into focus by AI.
This research is important as it identifies changes in the structure of the market over the last 30 years.
The research used a stochastic geometry technique to embed S&P500 yearly batches of data in subspace for analysis.
This research is important as it identifies changes in the structure of the market over the last 30 years.
The study made a significant technical contribution by developing new measures for analyzing market geometry.
This research is novel as it uses stochastic geometry to analyze market behavior and identifies changes in market structure over time.
Discussion 0