Authors
Summary
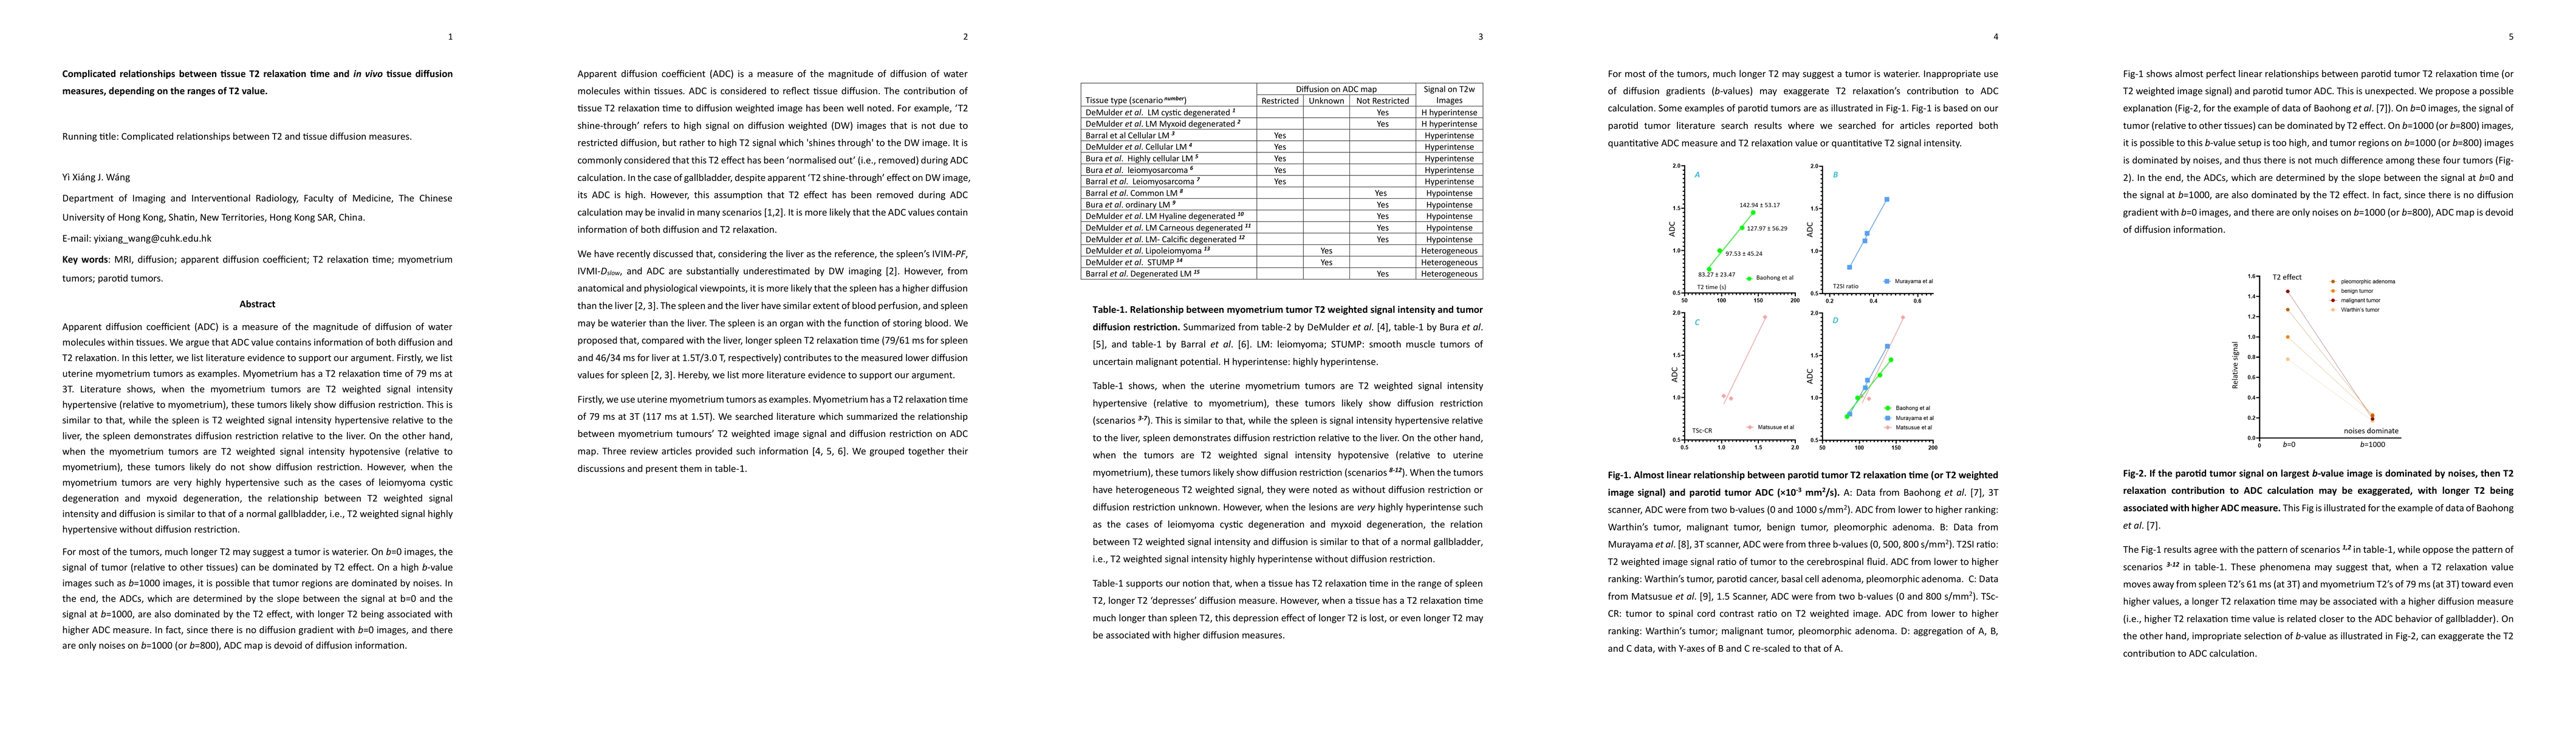
Apparent diffusion coefficient (ADC) is a measure of the magnitude of diffusion of water molecules within tissues. We argue that ADC value contains information of both diffusion and T2 relaxation. In this letter, we list literature evidence to support our argument. Firstly, we list uterine myometrium tumors as examples. Myometrium has a T2 relaxation time of 79 ms at 3T. Literature shows, when the myometrium tumors are T2 weighted signal intensity hypertensive (relative to myometrium), these tumors likely show diffusion restriction. This is similar to that, while the spleen is T2 weighted signal intensity hypertensive relative to the liver, the spleen demonstrates diffusion restriction relative to the liver. On the other hand, when the myometrium tumors are T2 weighted signal intensity hypotensive (relative to myometrium), these tumors likely do not show diffusion restriction. However, when the myometrium tumors are very highly hypertensive such as the cases of leiomyoma cystic degeneration and myxoid degeneration, the relationship between T2 weighted signal intensity and diffusion is similar to that of a normal gallbladder, i.e., T2 weighted signal highly hypertensive without diffusion restriction. For most of the tumors, much longer T2 may suggest a tumor is waterier. On b=0 images, the signal of tumor (relative to other tissues) can be dominated by T2 effect. On a high b-value images such as b=1000 images, it is possible that tumor regions are dominated by noises. In the end, the ADCs, which are determined by the slope between the signal at b=0 and the signal at b=1000, are also dominated by the T2 effect, with longer T2 being associated with higher ADC measure. In fact, since there is no diffusion gradient with b=0 images, and there are only noises on b=1000 (or b=800), ADC map is devoid of diffusion information.
AI Key Findings
Get AI-generated insights about this paper's methodology, results, and significance.
Paper Details
PDF Preview
Key Terms
Citation Network
Current paper (gray), citations (green), references (blue)
Display is limited for performance on very large graphs.
Similar Papers
Found 4 papersCompartment-specific estimation of T2 and T2* with diffusion-PEPTIDE MRI
Hui Zhang, Ting Gong, Kawin Setsompop et al.
The contribution of T2 relaxation time to diffusion MRI quantification and its clinical implications: a hypothesis
Yi Xiang J Wang, Kai-Xuan Zhao, Fu-Zhao Ma et al.
Long-term prognostic value of native myocardial tissue relaxation parameters (T1, T2, and T1ρ) in patients with precapillary pulmonary hypertension.
Zhang, Ying, Wang, Yue, Han, Yuchi et al.
| Title | Authors | Year | Actions |
|---|
Comments (0)