Data Type Agnostic Visual Sensitivity Analysis
Publication
Metrics
AI Quick Summary
This paper develops a visual analytics prototype for data type agnostic visual sensitivity analysis tailored for spatial blind source separation (SBSS) models, enabling parameter-output relation exploration with only dissimilarity measures. The prototype was heuristically evaluated, demonstrating its utility in identifying parameter-output associations and highlighting future research opportunities.
Paper Preview
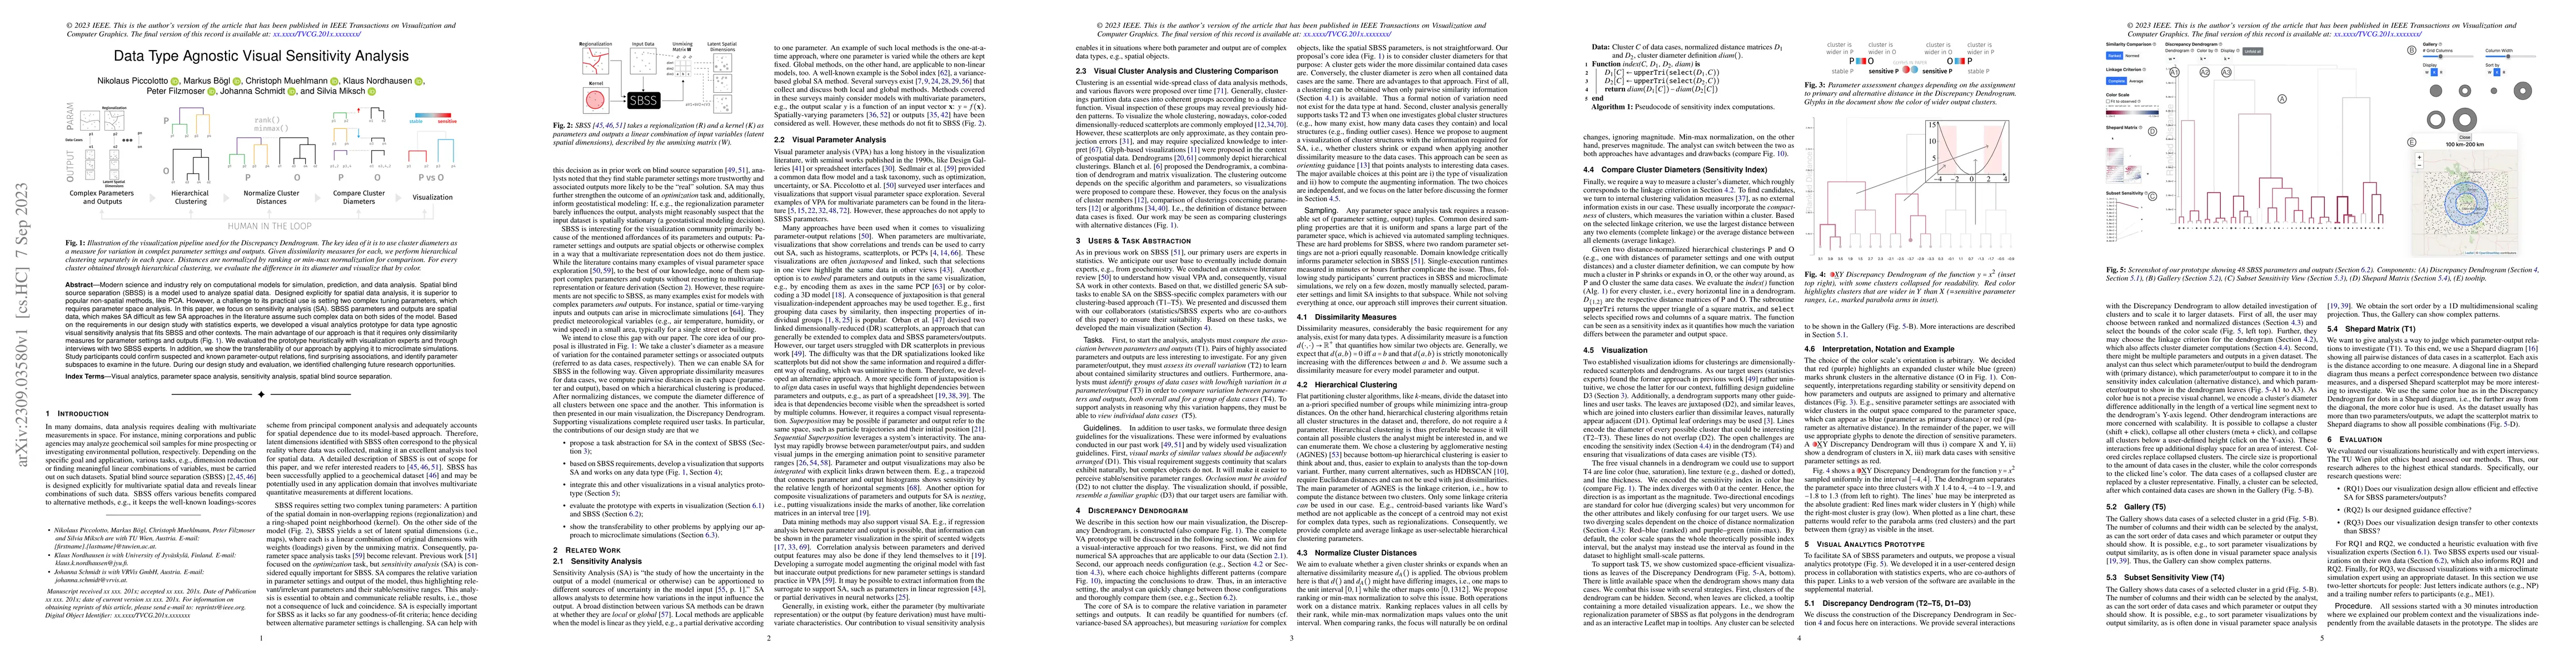
Abstract
Modern science and industry rely on computational models for simulation, prediction, and data analysis. Spatial blind source separation (SBSS) is a model used to analyze spatial data. Designed explicitly for spatial data analysis, it is superior to popular non-spatial methods, like PCA. However, a challenge to its practical use is setting two complex tuning parameters, which requires parameter space analysis. In this paper, we focus on sensitivity analysis (SA). SBSS parameters and outputs are spatial data, which makes SA difficult as few SA approaches in the literature assume such complex data on both sides of the model. Based on the requirements in our design study with statistics experts, we developed a visual analytics prototype for data type agnostic visual sensitivity analysis that fits SBSS and other contexts. The main advantage of our approach is that it requires only dissimilarity measures for parameter settings and outputs. We evaluated the prototype heuristically with visualization experts and through interviews with two SBSS experts. In addition, we show the transferability of our approach by applying it to microclimate simulations. Study participants could confirm suspected and known parameter-output relations, find surprising associations, and identify parameter subspaces to examine in the future. During our design study and evaluation, we identified challenging future research opportunities.
AI Key Findings
Get AI-generated insights about this paper's methodology, results, significance, and more — seven facets brought into focus.
Impact
Paper Details
Authors
PDF Preview
Key Terms
Citation Network
Current paper (gray), citations (green), references (blue)
Display is limited for performance on very large graphs.
Discussion 0