Data Visualization for Improving Financial Literacy: A Systematic Review
Publication
Metrics
AI Quick Summary
This systematic review of 37 research papers explores the use of data visualization in financial education, categorizing studies into five key areas: historical context, motivations, financial topics, tools, and effectiveness evaluation. It identifies gaps and suggests opportunities for enhancing financial literacy through visual tools, offering practical insights for educators and professionals.
Paper Preview
Abstract
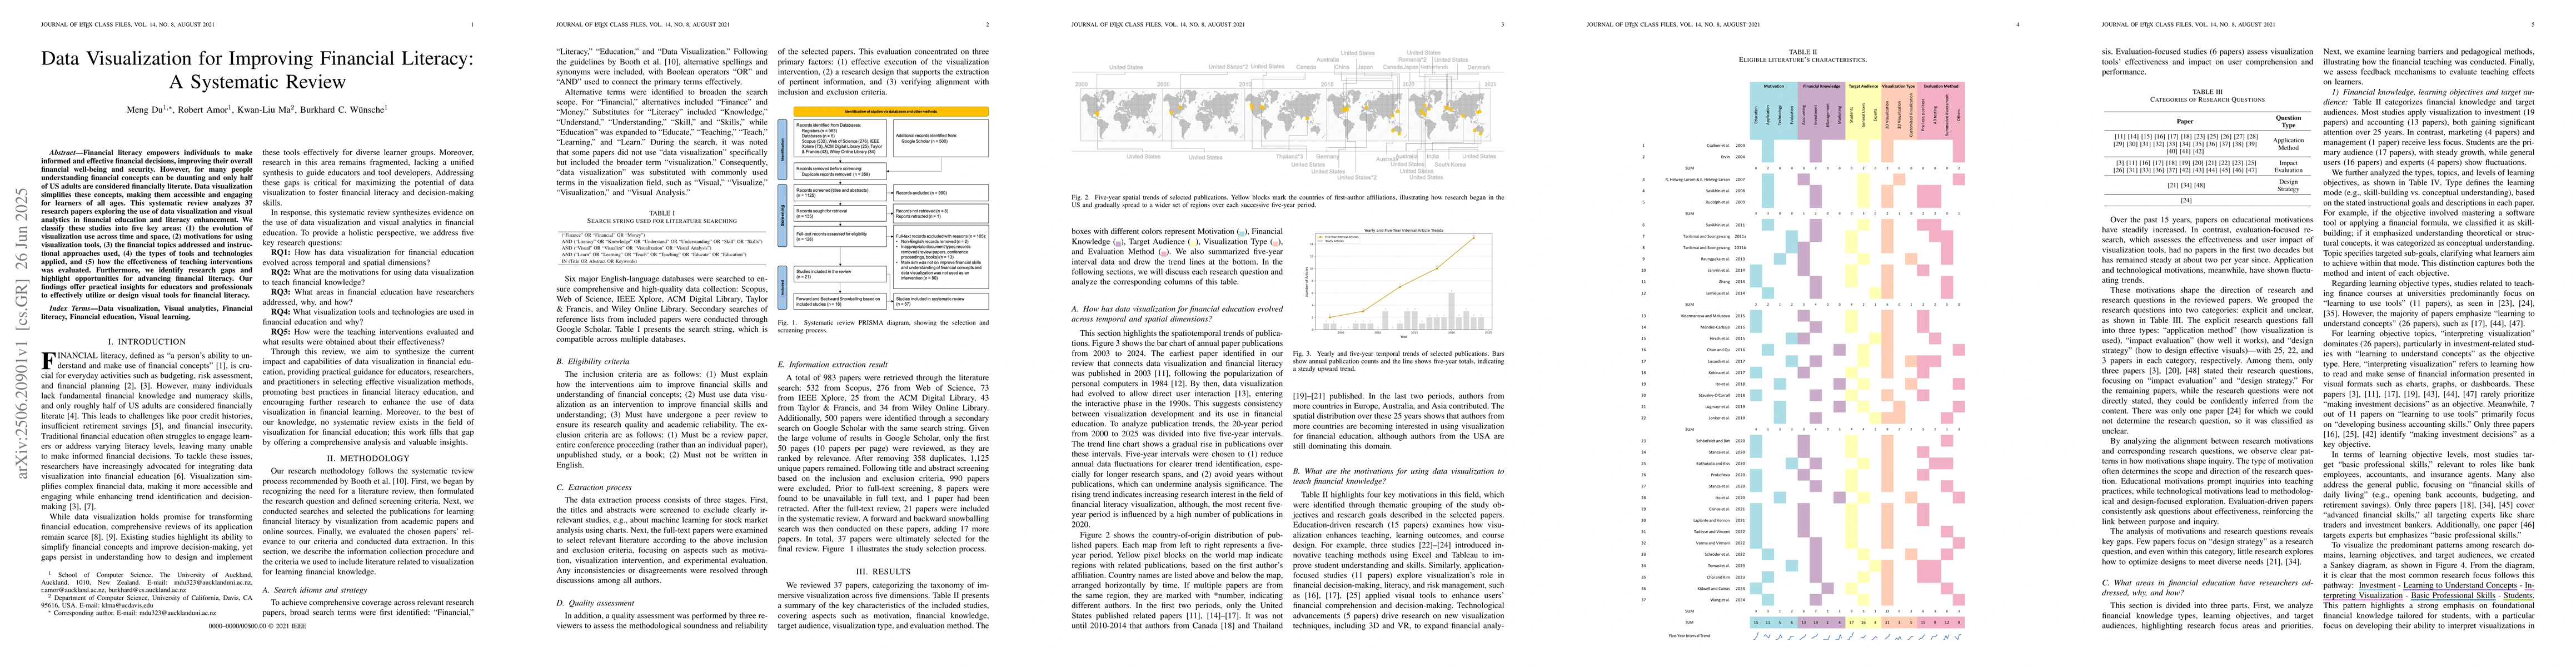
Financial literacy empowers individuals to make informed and effective financial decisions, improving their overall financial well-being and security. However, for many people understanding financial concepts can be daunting and only half of US adults are considered financially literate. Data visualization simplifies these concepts, making them accessible and engaging for learners of all ages. This systematic review analyzes 37 research papers exploring the use of data visualization and visual analytics in financial education and literacy enhancement. We classify these studies into five key areas: (1) the evolution of visualization use across time and space, (2) motivations for using visualization tools, (3) the financial topics addressed and instructional approaches used, (4) the types of tools and technologies applied, and (5) how the effectiveness of teaching interventions was evaluated. Furthermore, we identify research gaps and highlight opportunities for advancing financial literacy. Our findings offer practical insights for educators and professionals to effectively utilize or design visual tools for financial literacy.
AI Key Findings
Get AI-generated insights about this paper's methodology, results, significance, and more — seven facets brought into focus.
Impact
Authors
PDF Preview
Citation Network
Current paper (gray), citations (green), references (blue)
Display is limited for performance on very large graphs.
Discussion 0