DataGarden: Exploring our Community in a VR Data Visualization
Publication
Metrics
AI Quick Summary
DataGarden is a VR system designed to enhance data visualization through embodied interactions, aiming to foster deeper empathy for the people represented in the data by moving beyond traditional simplified charts and graphs. The immersive environment seeks to rethink conventional visualization methods.
Paper Preview
Abstract
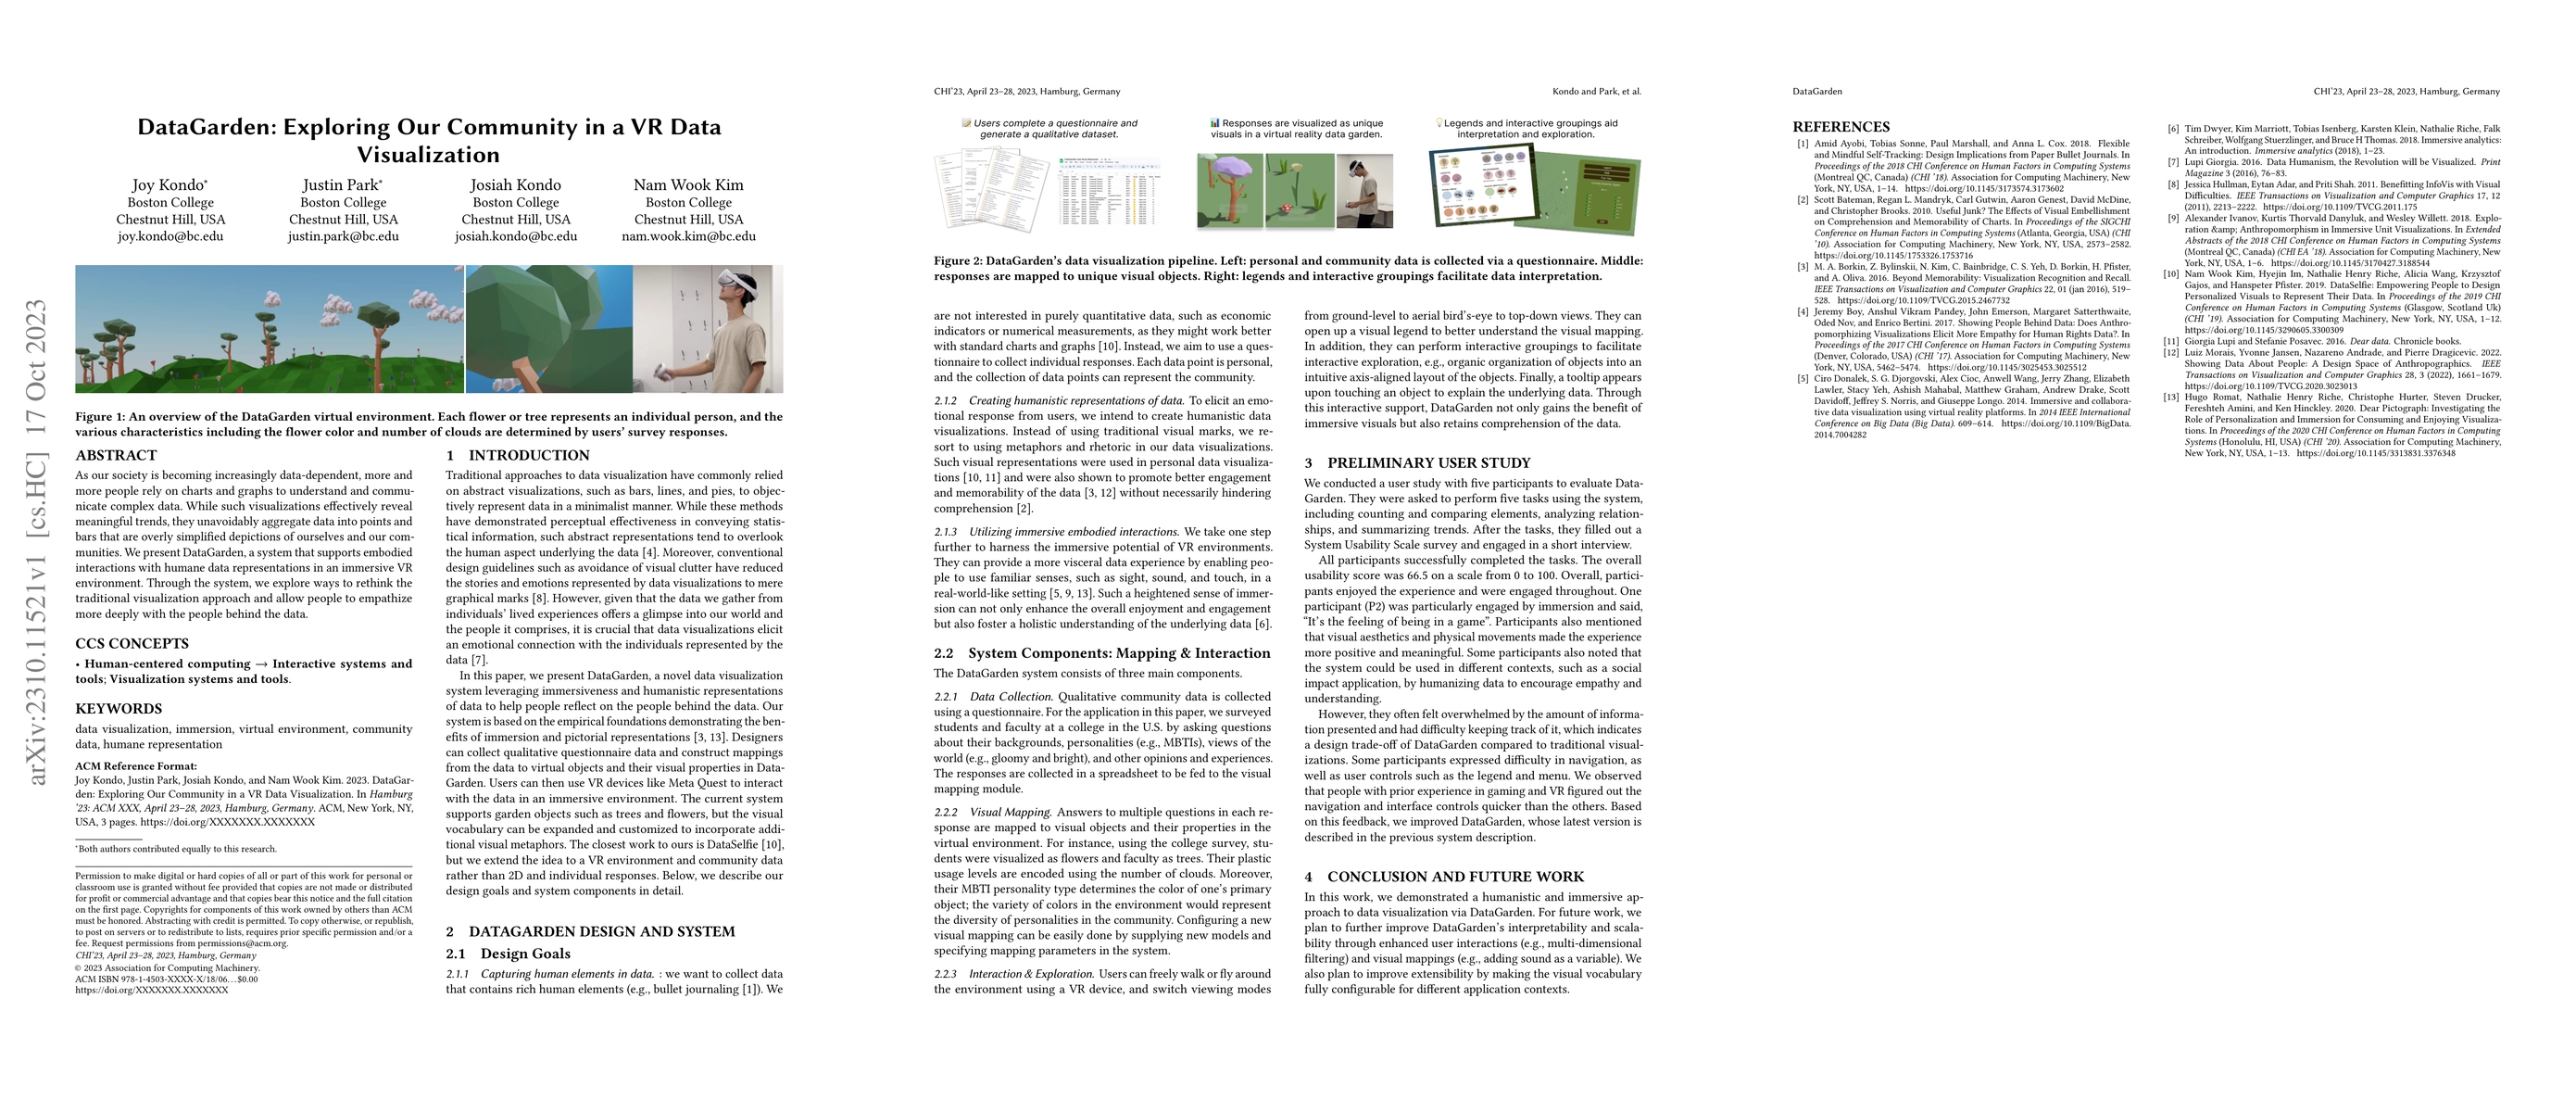
As our society is becoming increasingly data-dependent, more and more people rely on charts and graphs to understand and communicate complex data. While such visualizations effectively reveal meaningful trends, they unavoidably aggregate data into points and bars that are overly simplified depictions of ourselves and our communities. We present DataGarden, a system that supports embodied interactions with humane data representations in an immersive VR environment. Through the system, we explore ways to rethink the traditional visualization approach and allow people to empathize more deeply with the people behind the data.
OpenAlex
- Citations in OpenAlex
- 0
- Publication year
- 2023
- Access status
- Open access
Source: OpenAlex · Snapshot
AI Key Findings
Get AI-generated insights about this paper's methodology, results, significance, and more — seven facets brought into focus.
Impact
Paper Details
Authors
PDF Preview
Key Terms
Citation Network
Current paper (gray), citations (green), references (blue)
Display is limited for performance on very large graphs.
Discussion 0