DAVID: Influence Diagram Processing System for the Macintosh
1304.3108
Published Apr 12, 2013
33 citations
Publication
Published:
Apr 12, 2013
Updated:
Jun 02, 2025
Categories:
cs.AI
Metrics
Citations:
33
Source:
ArXiv
Paper Preview
Abstract
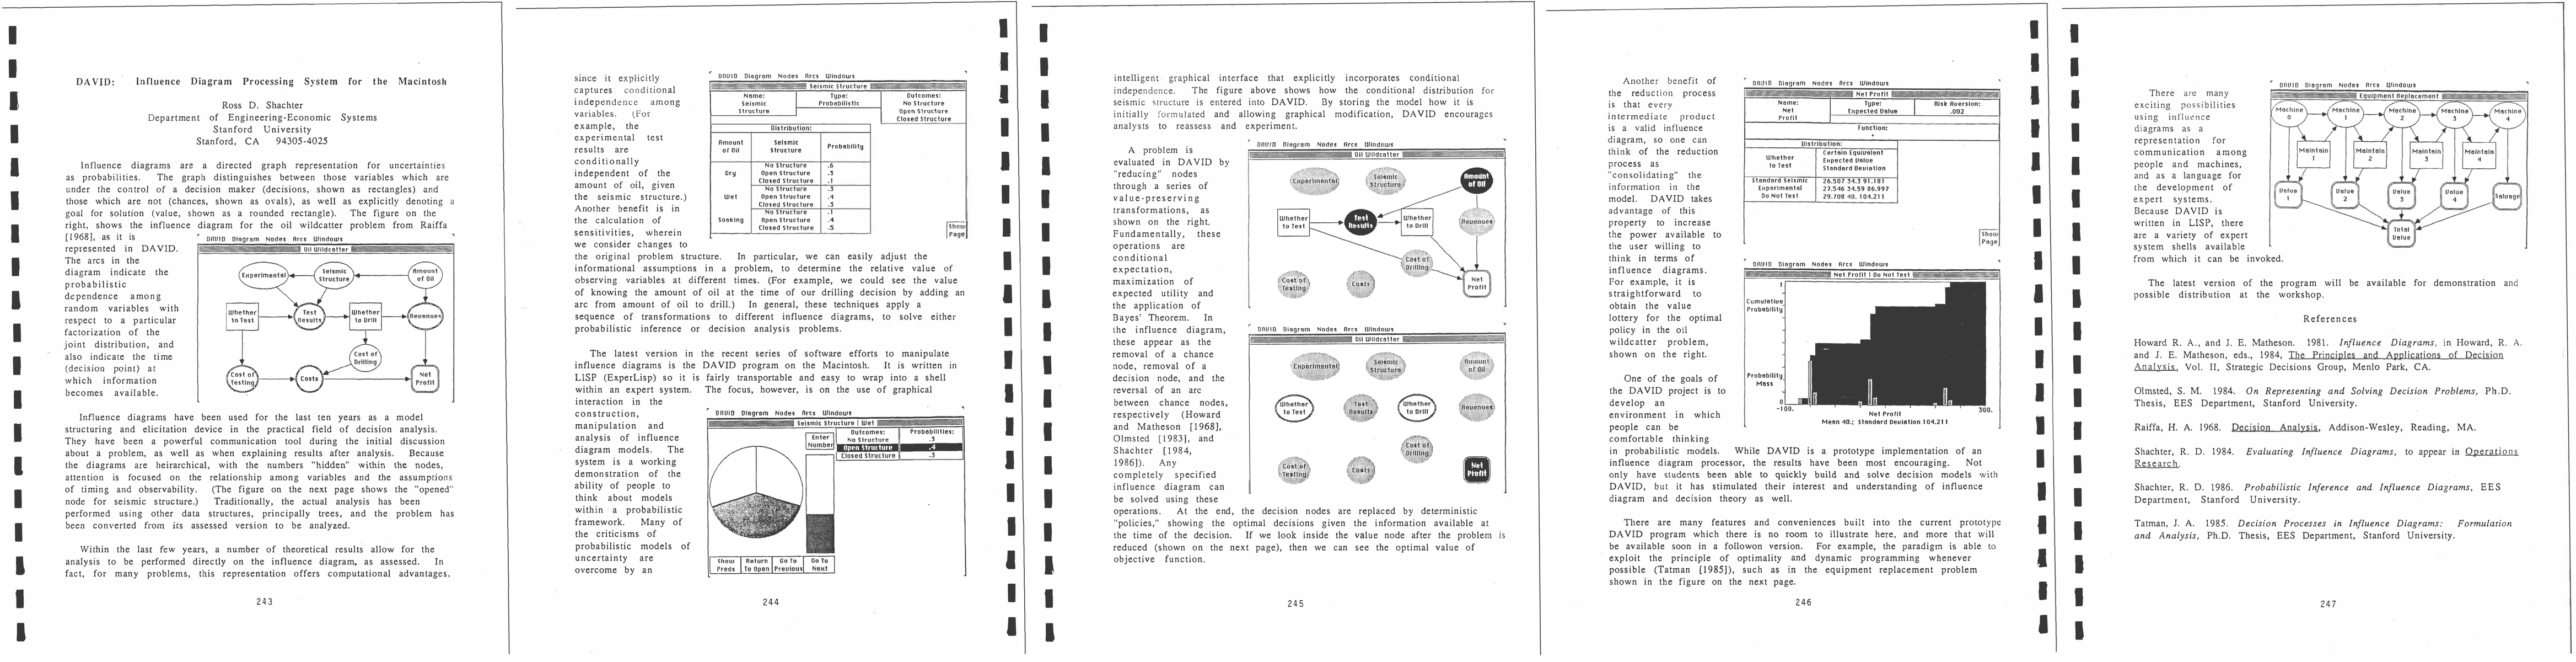
Influence diagrams are a directed graph representation for uncertainties as probabilities. The graph distinguishes between those variables which are under the control of a decision maker (decisions, shown as rectangles) and those which are not (chances, shown as ovals), as well as explicitly denoting a goal for solution (value, shown as a rounded rectangle.
AI Key Findings
Get AI-generated insights about this paper's methodology, results, significance, and more — seven facets brought into focus.
Listen to Summary
AI-generated audio breakdown
0:00
0:00
Impact
33
Citations
7
References
Paper Details
Paper ID:
1304.3108
License:
http://arxiv.org/licenses/nonexclusive-distrib/1.0/
Comments:
Appears in Proceedings of the Second Conference on Uncertainty in
Artificial Intelligence (UAI1986)
Report No:
UAI-P-1986-PG-243-248
Categories:
cs.AI
PDF Preview
Key Terms
shown
(0.349)
graph
(0.332)
decisions
(0.275)
diagrams
(0.272)
directed
(0.272)
probabilities
(0.260)
uncertainties
(0.256)
decision
(0.248)
Citation Network
Current paper (gray), citations (green), references (blue)
Display is limited for performance on very large graphs.
Current Paper
Citations
References
Click to view
Discussion 0