Decoding Stock Market Behavior with the Topological Quantum Computer
Publication
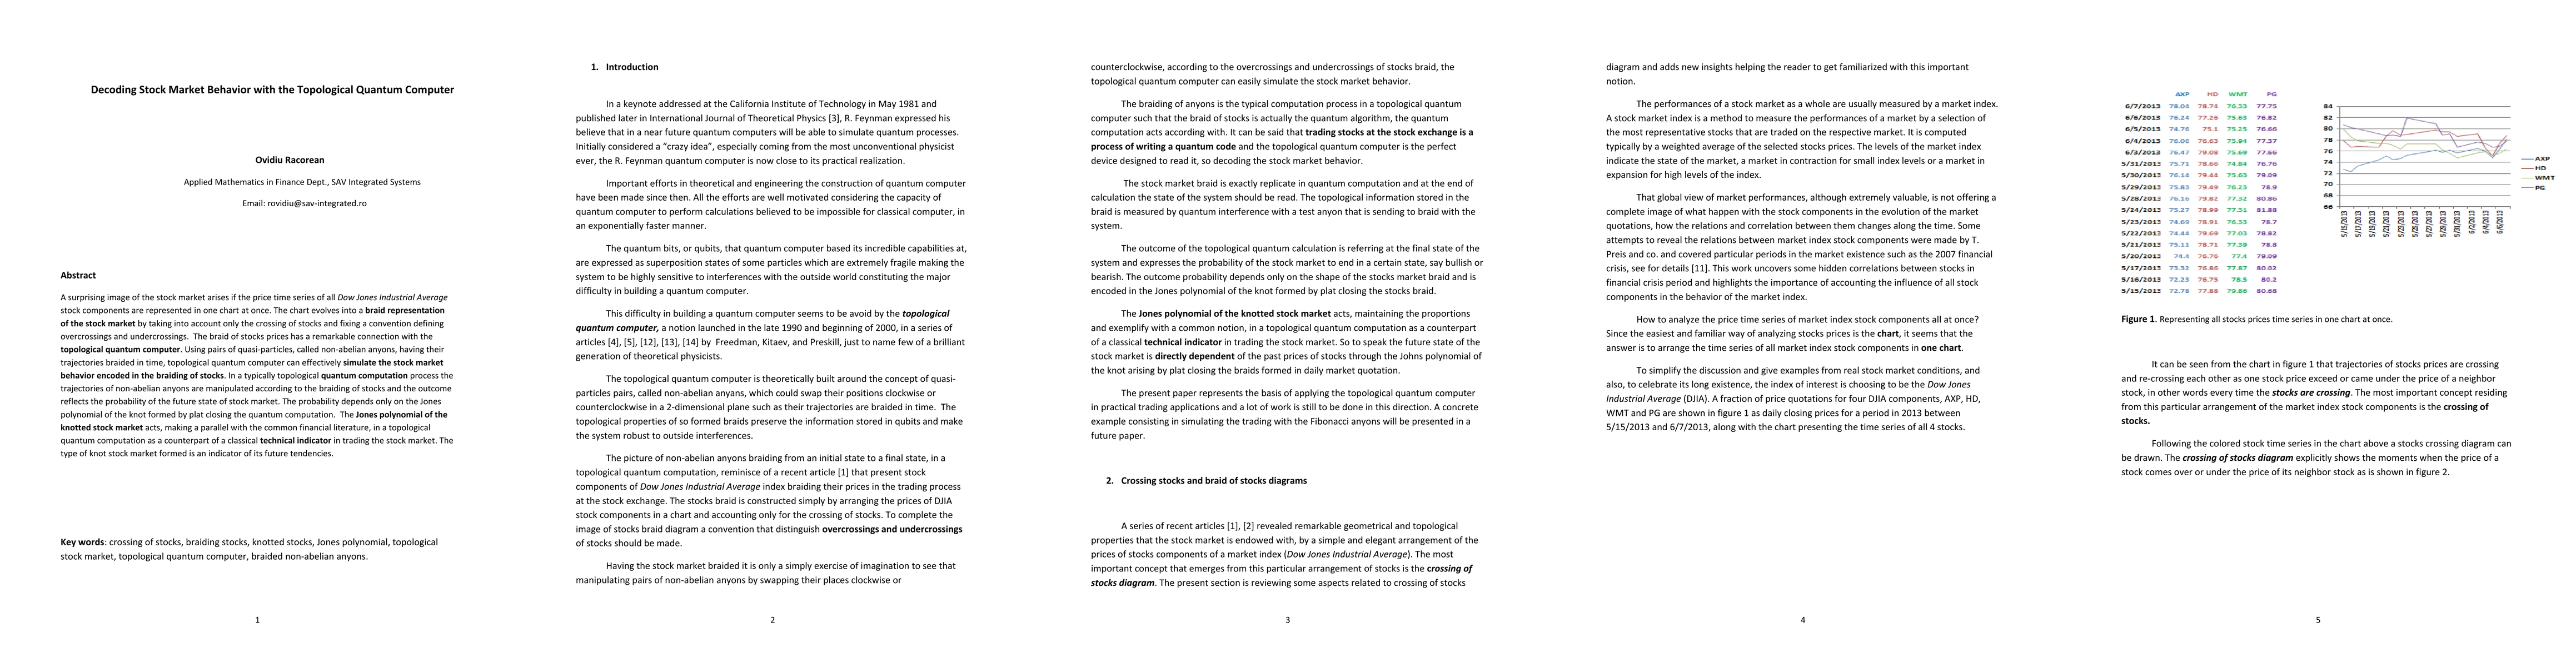
Metrics
AI Quick Summary
Researchers used a topological quantum computer to simulate stock market behavior, revealing a knot-like pattern that reflects future trends. This 'knot' is analogous to a classical technical indicator, providing a new perspective on predicting stock market outcomes.
Paper Preview
Abstract
A surprising image of the stock market arises if the price time series of all Dow Jones Industrial Average stock components are represented in one chart at once. The chart evolves into a braid representation of the stock market by taking into account only the crossing of stocks and fixing a convention defining overcrossings and undercrossings. The braid of stocks prices has a remarkable connection with the topological quantum computer. Using pairs of quasi-particles, called non-abelian anyons, having their trajectories braided in time, topological quantum computer can effectively simulate the stock market behavior encoded in the braiding of stocks. In a typically topological quantum computation process the trajectories of non-abelian anyons are manipulated according to the braiding of stocks and the outcome reflects the probability of the future state of stock market. The probability depends only on the Jones polynomial of the knot formed by plat closing the quantum computation. The Jones polynomial of the knotted stock market acts, making a parallel with the common financial literature, in a topological quantum computation as a counterpart of a classical technical indicator in trading the stock market. The type of knot stock market formed is an indicator of its future tendencies.
AI Key Findings
Get AI-generated insights about this paper's methodology, results, significance, and more — seven facets brought into focus.
Impact
Paper Details
PDF Preview
Key Terms
Citation Network
Current paper (gray), citations (green), references (blue)
Display is limited for performance on very large graphs.
Discussion 0