Authors
Summary
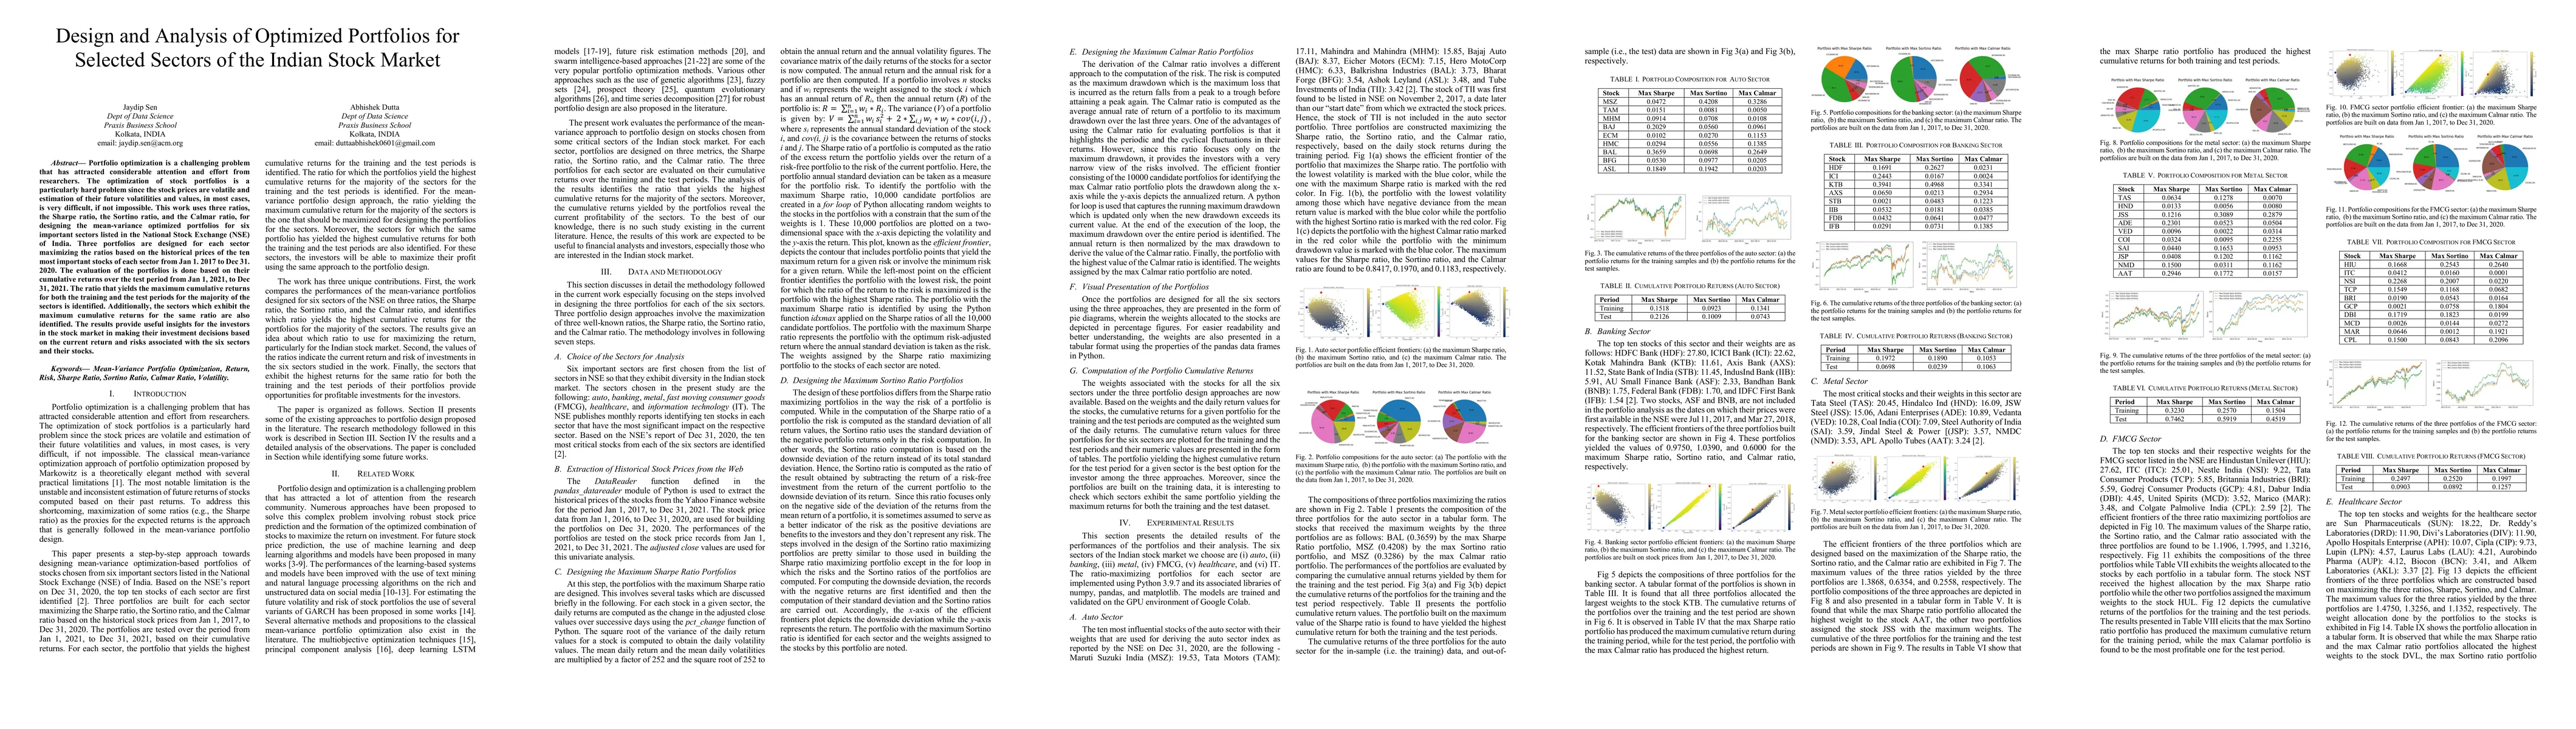
Portfolio optimization is a challenging problem that has attracted considerable attention and effort from researchers. The optimization of stock portfolios is a particularly hard problem since the stock prices are volatile and estimation of their future volatilities and values, in most cases, is very difficult, if not impossible. This work uses three ratios, the Sharpe ratio, the Sortino ratio, and the Calmar ratio, for designing the mean-variance optimized portfolios for six important sectors listed in the National Stock Exchange (NSE) of India. Three portfolios are designed for each sector maximizing the ratios based on the historical prices of the ten most important stocks of each sector from Jan 1, 2017, to Dec 31, 2020. The evaluation of the portfolios is done based on their cumulative returns over the test period from Jan 1, 2021, to Dec 31, 2021. The ratio that yields the maximum cumulative returns for both the training and the test periods for the majority of the sectors is identified. The sectors that exhibit the maximum cumulative returns for the same ratio are also identified. The results provide useful insights for investors in the stock market in making their investment decisions based on the current return and risks associated with the six sectors and their stocks.
AI Key Findings
Get AI-generated insights about this paper's methodology, results, and significance.
Paper Details
PDF Preview
Key Terms
Citation Network
Current paper (gray), citations (green), references (blue)
Display is limited for performance on very large graphs.
Similar Papers
Found 4 papersStock Performance Evaluation for Portfolio Design from Different Sectors of the Indian Stock Market
Jaydip Sen, Sanket Das, Arpit Awad et al.
Precise Stock Price Prediction for Robust Portfolio Design from Selected Sectors of the Indian Stock Market
Jaydip Sen, Ashwin Kumar R S, Geetha Joseph et al.
A Portfolio Rebalancing Approach for the Indian Stock Market
Jaydip Sen, Subhasis Dasgupta, Arup Dasgupta et al.
| Title | Authors | Year | Actions |
|---|
Comments (0)