Summary
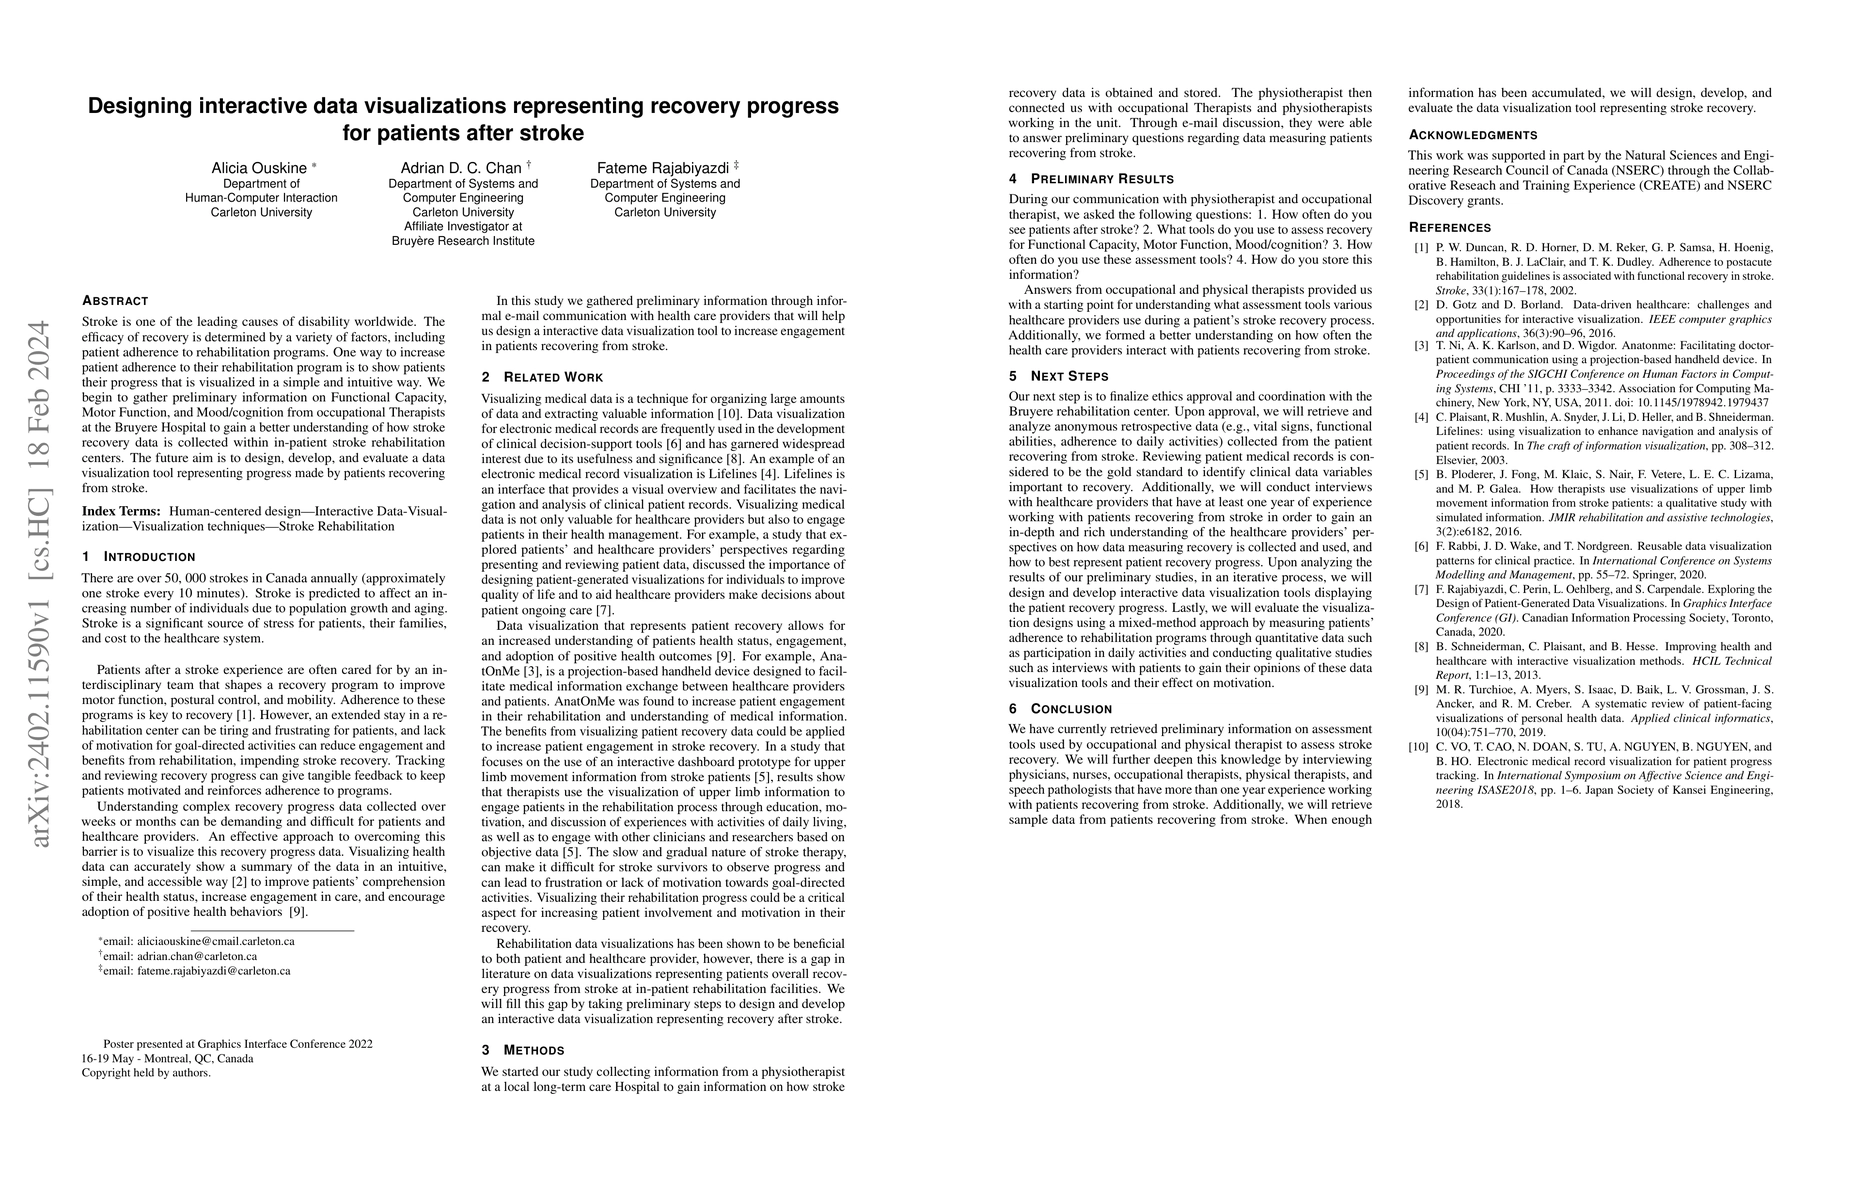
Stroke is one of the leading causes of disability worldwide. The efficacy of recovery is determined by a variety of factors, including patient adherence to rehabilitation programs. One way to increase patient adherence to their rehabilitation program is to show patients their progress that is visualized in a simple and intuitive way. We begin to gather preliminary information on Functional Capacity, Motor Function, and Mood/cognition from occupational Therapists at the Bruyere Hospital to gain a better understanding of how stroke recovery data is collected within in-patient stroke rehabilitation centers. The future aim is to design, develop, and evaluate a data visualization tool representing progress made by patients recovering from stroke.
AI Key Findings
Get AI-generated insights about this paper's methodology, results, and significance.
Paper Details
PDF Preview
Key Terms
Citation Network
Current paper (gray), citations (green), references (blue)
Display is limited for performance on very large graphs.
Similar Papers
Found 4 papersIdentifying Challenges in Designing, Developing and Evaluating Data Visualizations for Large Displays
Fateme Rajabiyazdi, Mahsa Sinaei Hamed, Pak Kwan et al.
No citations found for this paper.

Comments (0)