Designing Visual Learning Analytics for Supporting Equity in STEM Classrooms
Publication
Metrics
AI Quick Summary
This study explores the design of visual learning analytics to support equitable STEM instruction by engaging middle school science teachers in iterative testing of data visualizations disaggregated by gender and race. The findings provide insights into how teachers interpret student data and inform the refinement of visual feedback tools like the Student Electronic Exit Ticket (SEET).
Paper Preview
Abstract
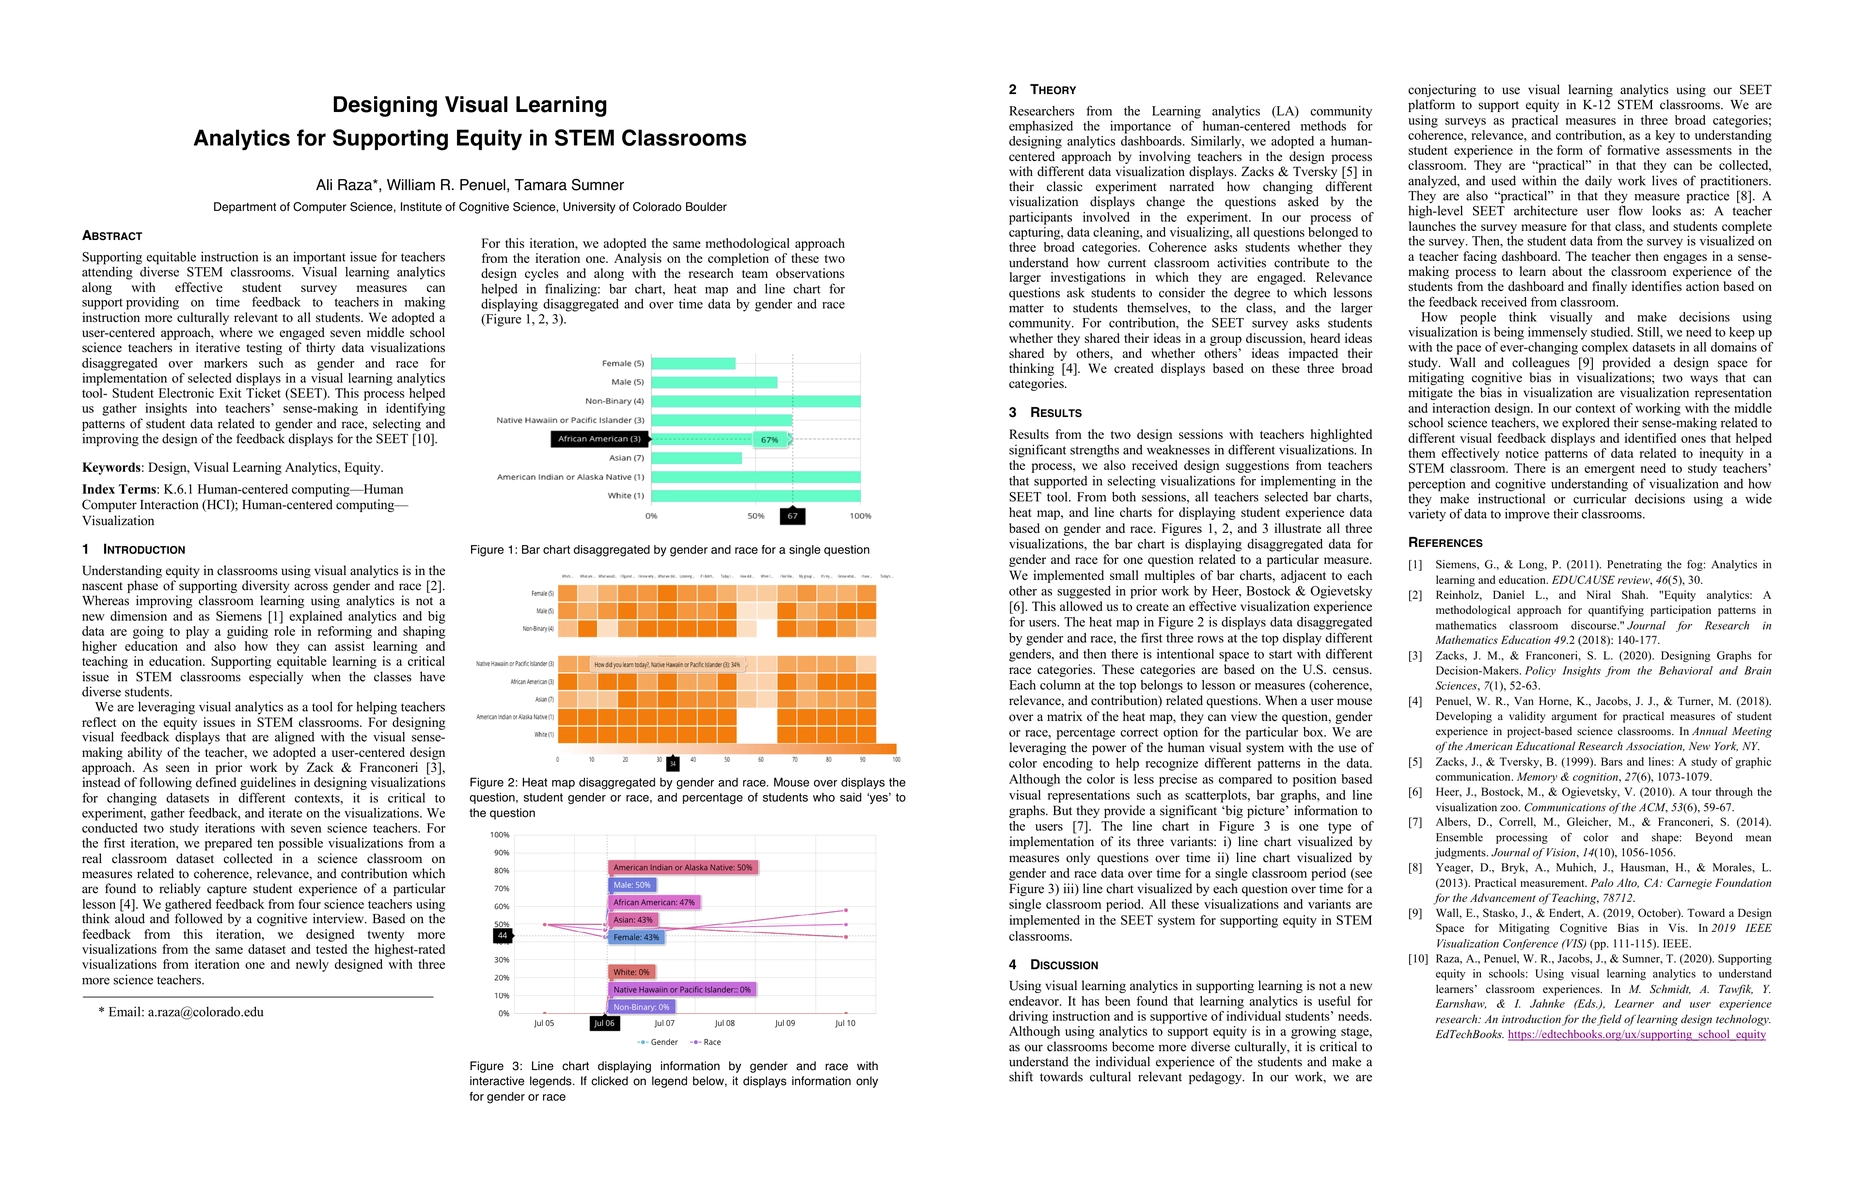
Supporting equitable instruction is an important issue for teachers attending diverse STEM classrooms. Visual learning analytics along with effective student survey measures can support providing on time feedback to teachers in making instruction more culturally relevant to all students. We adopted a user-centered approach, where we engaged seven middle school science teachers in iterative testing of thirty data visualizations disaggregated over markers such as gender and race for implementation of selected displays in a visual learning analytics tool- Student Electronic Exit Ticket (SEET). This process helped us gather insights into teachers' sensemaking in identifying patterns of student data related to gender and race, selecting and improving the design of the feedback displays for the SEET [10].
AI Key Findings
Get AI-generated insights about this paper's methodology, results, significance, and more — seven facets brought into focus.
Impact
Paper Details
Authors
PDF Preview
Key Terms
Citation Network
Current paper (gray), citations (green), references (blue)
Display is limited for performance on very large graphs.
Discussion 0