Summary
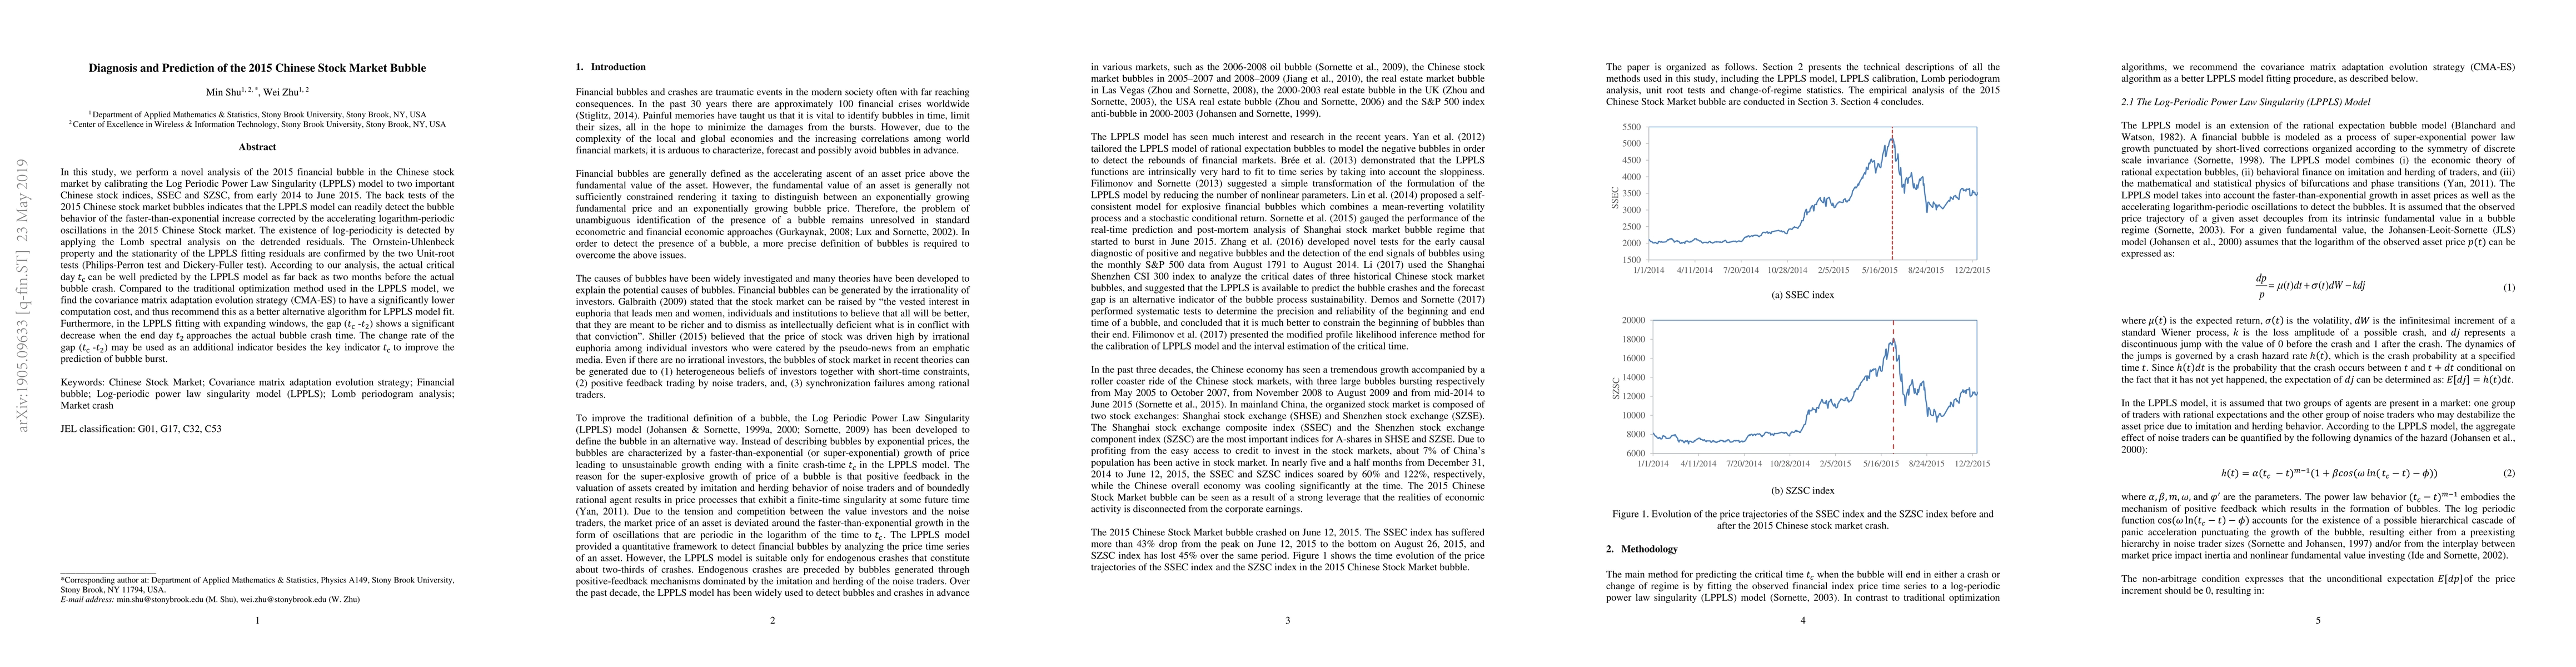
In this study, we perform a novel analysis of the 2015 financial bubble in the Chinese stock market by calibrating the Log Periodic Power Law Singularity (LPPLS) model to two important Chinese stock indices, SSEC and SZSC, from early 2014 to June 2015. The back tests of the 2015 Chinese stock market bubbles indicates that the LPPLS model can readily detect the bubble behavior of the faster-than-exponential increase corrected by the accelerating logarithm-periodic oscillations in the 2015 Chinese Stock market. The existence of log-periodicity is detected by applying the Lomb spectral analysis on the detrended residuals. The Ornstein-Uhlenbeck property and the stationarity of the LPPLS fitting residuals are confirmed by the two Unit-root tests (Philips-Perron test and Dickery-Fuller test). According to our analysis, the actual critical day t_c can be well predicted by the LPPLS model as far back as two months before the actual bubble crash. Compared to the traditional optimization method used in the LPPLS model, we find the covariance matrix adaptation evolution strategy (CMA-ES) to have a significantly lower computation cost, and thus recommend this as a better alternative algorithm for LPPLS model fit. Furthermore, in the LPPLS fitting with expanding windows, the gap (tc -t2) shows a significant decrease when the end day t2 approaches the actual bubble crash time. The change rate of the gap (tc-t2) may be used as an additional indicator besides the key indicator tc to improve the prediction of bubble burst.
AI Key Findings
Get AI-generated insights about this paper's methodology, results, and significance.
Paper Details
PDF Preview
Key Terms
Citation Network
Current paper (gray), citations (green), references (blue)
Display is limited for performance on very large graphs.
Similar Papers
Found 4 papers| Title | Authors | Year | Actions |
|---|
Comments (0)