Dispersion vs Disparity: Hiding Variability Can Encourage Stereotyping When Visualizing Social Outcomes
Publication
Metrics
AI Quick Summary
This research investigates how different data visualization designs affect perceptions of social outcomes, finding that hiding variability in data can encourage stereotyping by promoting personal attributions for disparities. Visualizations that emphasize variability reduce stereotyping by highlighting external factors.
Paper Preview
Abstract
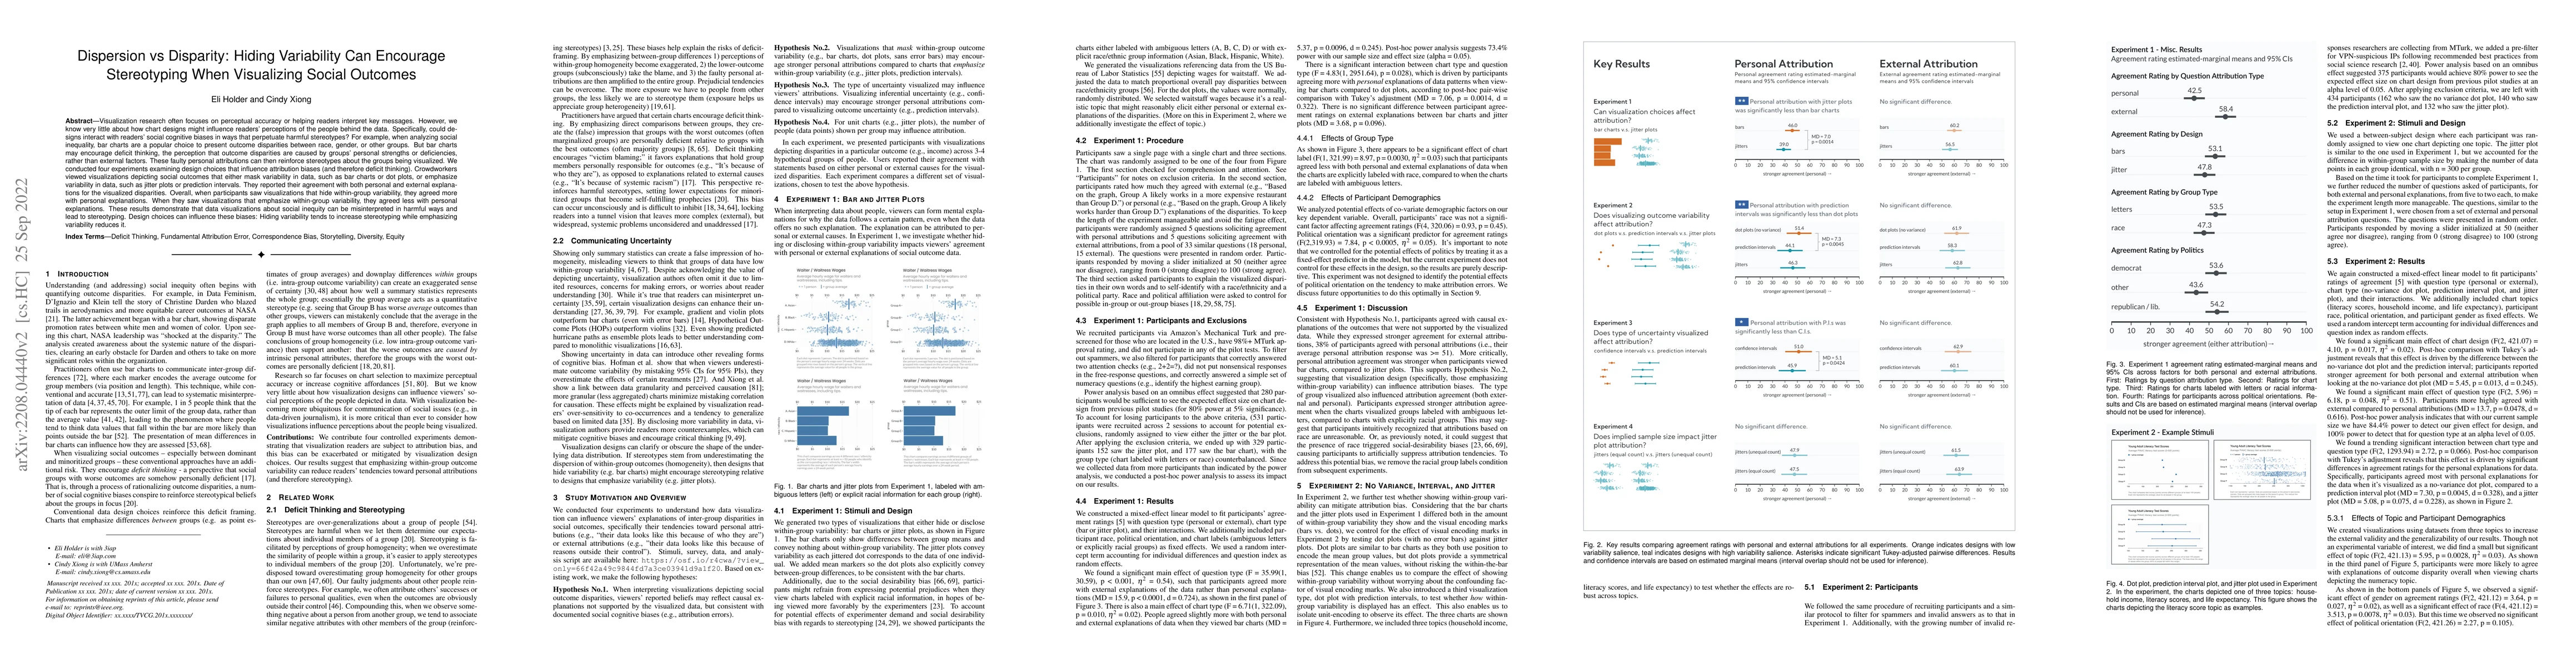
Visualization research often focuses on perceptual accuracy or helping readers interpret key messages. However, we know very little about how chart designs might influence readers' perceptions of the people behind the data. Specifically, could designs interact with readers' social cognitive biases in ways that perpetuate harmful stereotypes? For example, when analyzing social inequality, bar charts are a popular choice to present outcome disparities between race, gender, or other groups. But bar charts may encourage deficit thinking, the perception that outcome disparities are caused by groups' personal strengths or deficiencies, rather than external factors. These faulty personal attributions can then reinforce stereotypes about the groups being visualized. We conducted four experiments examining design choices that influence attribution biases (and therefore deficit thinking). Crowdworkers viewed visualizations depicting social outcomes that either mask variability in data, such as bar charts or dot plots, or emphasize variability in data, such as jitter plots or prediction intervals. They reported their agreement with both personal and external explanations for the visualized disparities. Overall, when participants saw visualizations that hide within-group variability, they agreed more with personal explanations. When they saw visualizations that emphasize within-group variability, they agreed less with personal explanations. These results demonstrate that data visualizations about social inequity can be misinterpreted in harmful ways and lead to stereotyping. Design choices can influence these biases: Hiding variability tends to increase stereotyping while emphasizing variability reduces it.
AI Key Findings
Get AI-generated insights about this paper's methodology, results, significance, and more — seven facets brought into focus.
Impact
Paper Details
Authors
PDF Preview
Key Terms
Citation Network
Current paper (gray), citations (green), references (blue)
Display is limited for performance on very large graphs.
Discussion 0