Distributional Regression U-Nets for the Postprocessing of Precipitation Ensemble Forecasts
Publication
Metrics
AI Quick Summary
This paper proposes a U-Net-based distributional regression method to postprocess precipitation ensemble forecasts, showing competitive performance against state-of-the-art methods in terms of predictive power for heavy precipitation events, though it struggles with calibration in high precipitation regions.
Paper Preview
Abstract
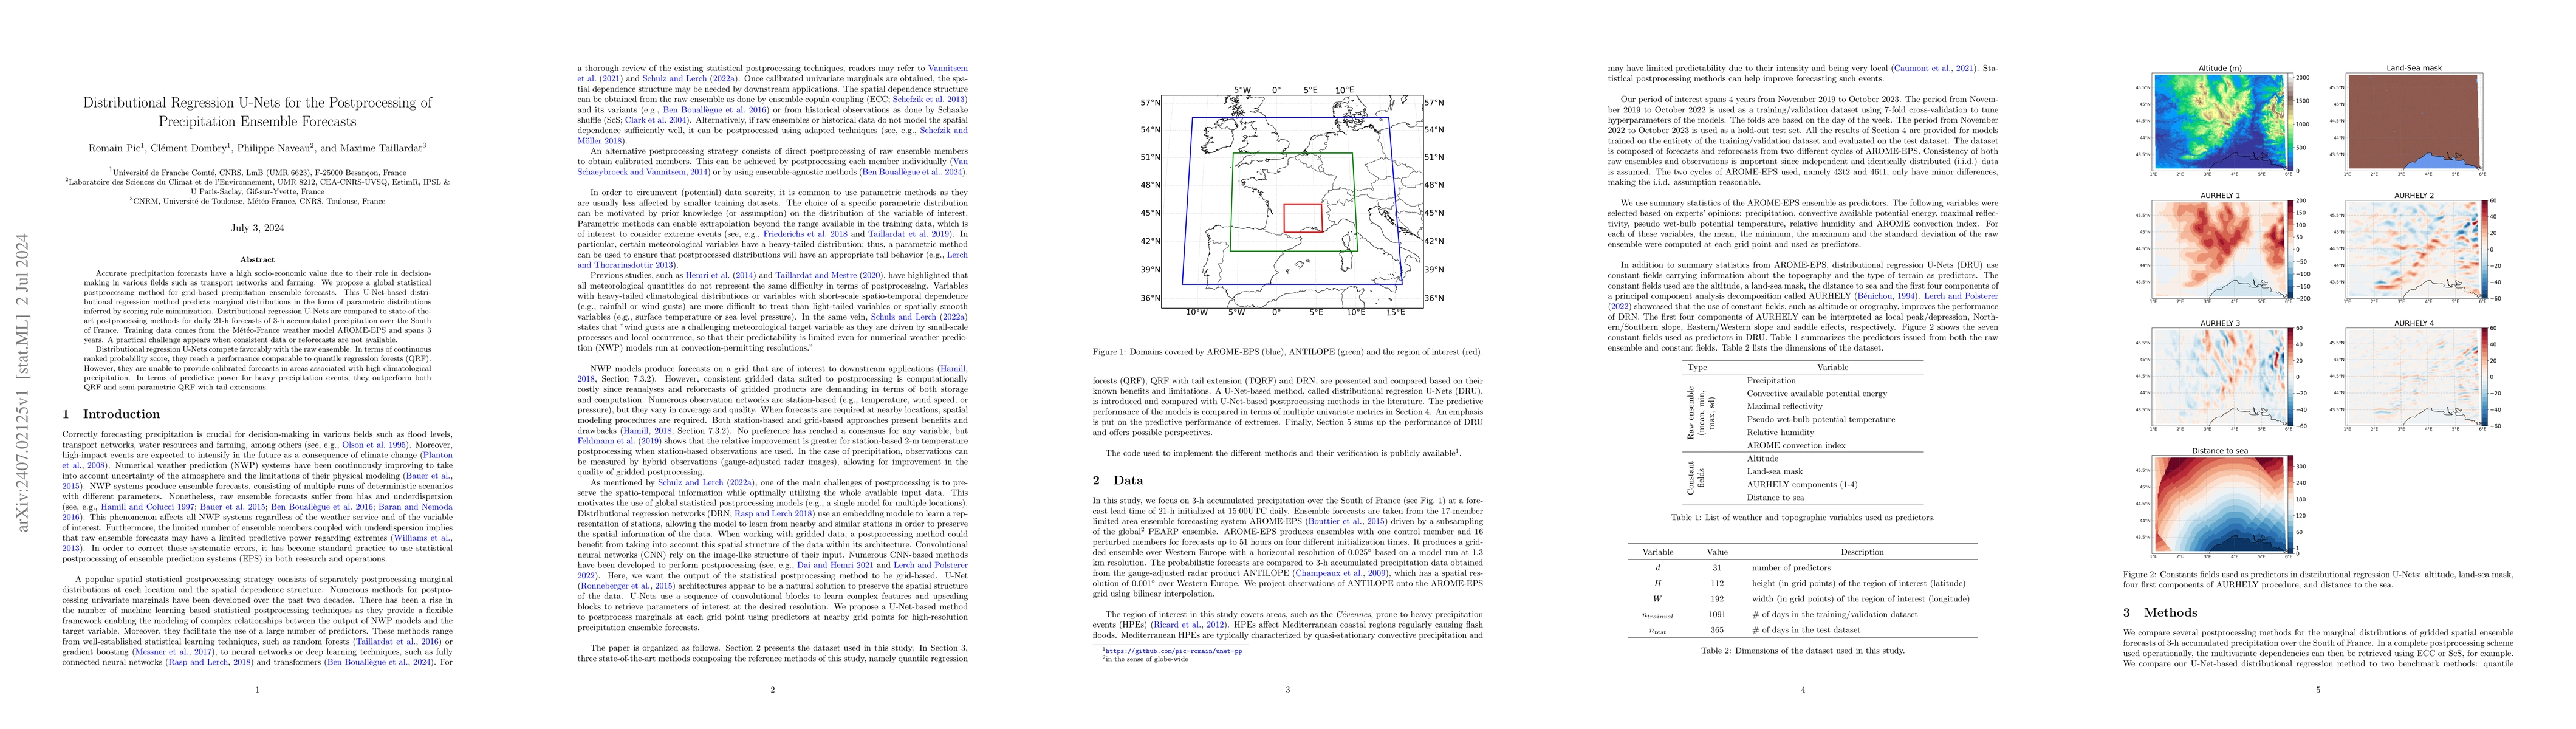
Accurate precipitation forecasts have a high socio-economic value due to their role in decision-making in various fields such as transport networks and farming. We propose a global statistical postprocessing method for grid-based precipitation ensemble forecasts. This U-Net-based distributional regression method predicts marginal distributions in the form of parametric distributions inferred by scoring rule minimization. Distributional regression U-Nets are compared to state-of-the-art postprocessing methods for daily 21-h forecasts of 3-h accumulated precipitation over the South of France. Training data comes from the M\'et\'eo-France weather model AROME-EPS and spans 3 years. A practical challenge appears when consistent data or reforecasts are not available. Distributional regression U-Nets compete favorably with the raw ensemble. In terms of continuous ranked probability score, they reach a performance comparable to quantile regression forests (QRF). However, they are unable to provide calibrated forecasts in areas associated with high climatological precipitation. In terms of predictive power for heavy precipitation events, they outperform both QRF and semi-parametric QRF with tail extensions.
AI Key Findings
Get AI-generated insights about this paper's methodology, results, significance, and more — seven facets brought into focus.
Impact
Authors
PDF Preview
Key Terms
Citation Network
Current paper (gray), citations (green), references (blue)
Display is limited for performance on very large graphs.
Discussion 0