Publication
Metrics
Paper Preview
Abstract
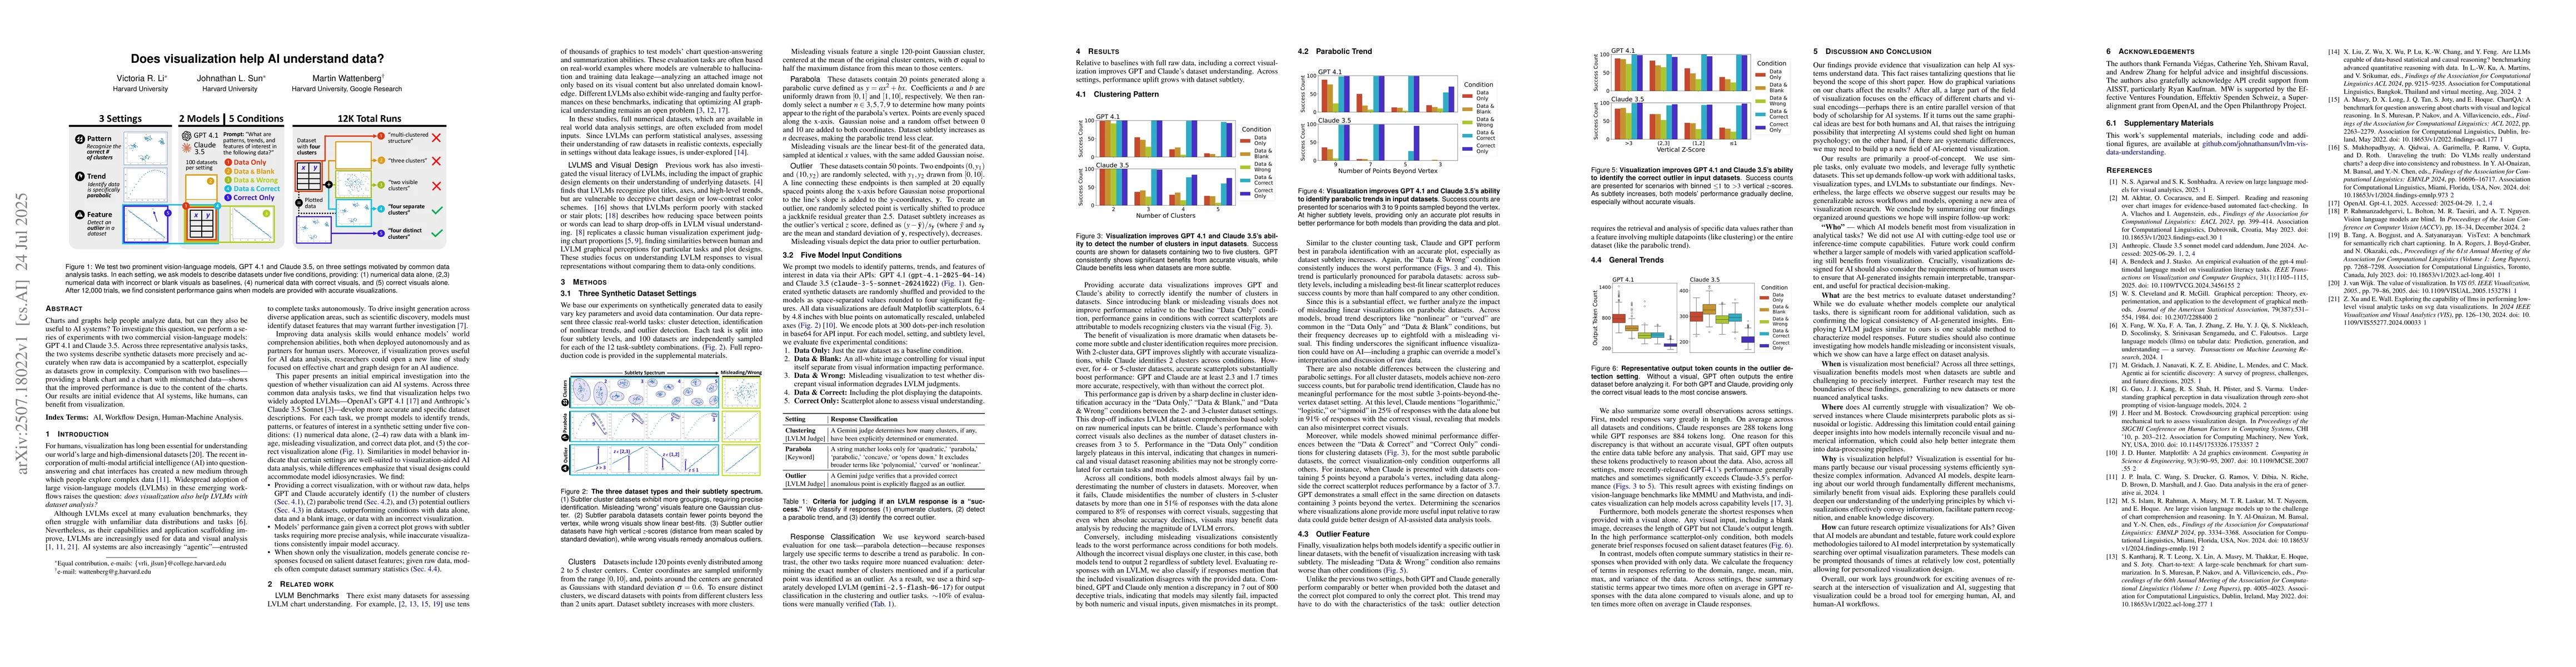
Charts and graphs help people analyze data, but can they also be useful to AI systems? To investigate this question, we perform a series of experiments with two commercial vision-language models: GPT 4.1 and Claude 3.5. Across three representative analysis tasks, the two systems describe synthetic datasets more precisely and accurately when raw data is accompanied by a scatterplot, especially as datasets grow in complexity. Comparison with two baselines -- providing a blank chart and a chart with mismatched data -- shows that the improved performance is due to the content of the charts. Our results are initial evidence that AI systems, like humans, can benefit from visualization.
AI Key Findings
Get AI-generated insights about this paper's methodology, results, significance, and more — seven facets brought into focus.
Impact
Paper Details
Authors
PDF Preview
Citation Network
Current paper (gray), citations (green), references (blue)
Display is limited for performance on very large graphs.
Discussion 0