EmphasisChecker is an interactive tool designed to help authors align chart and caption emphasis, ensuring readers remember intended messages. It highlights chart features and caption emphasis, detects mismatches, and aids in revisions, confirmed as useful and easy to use in a user study.
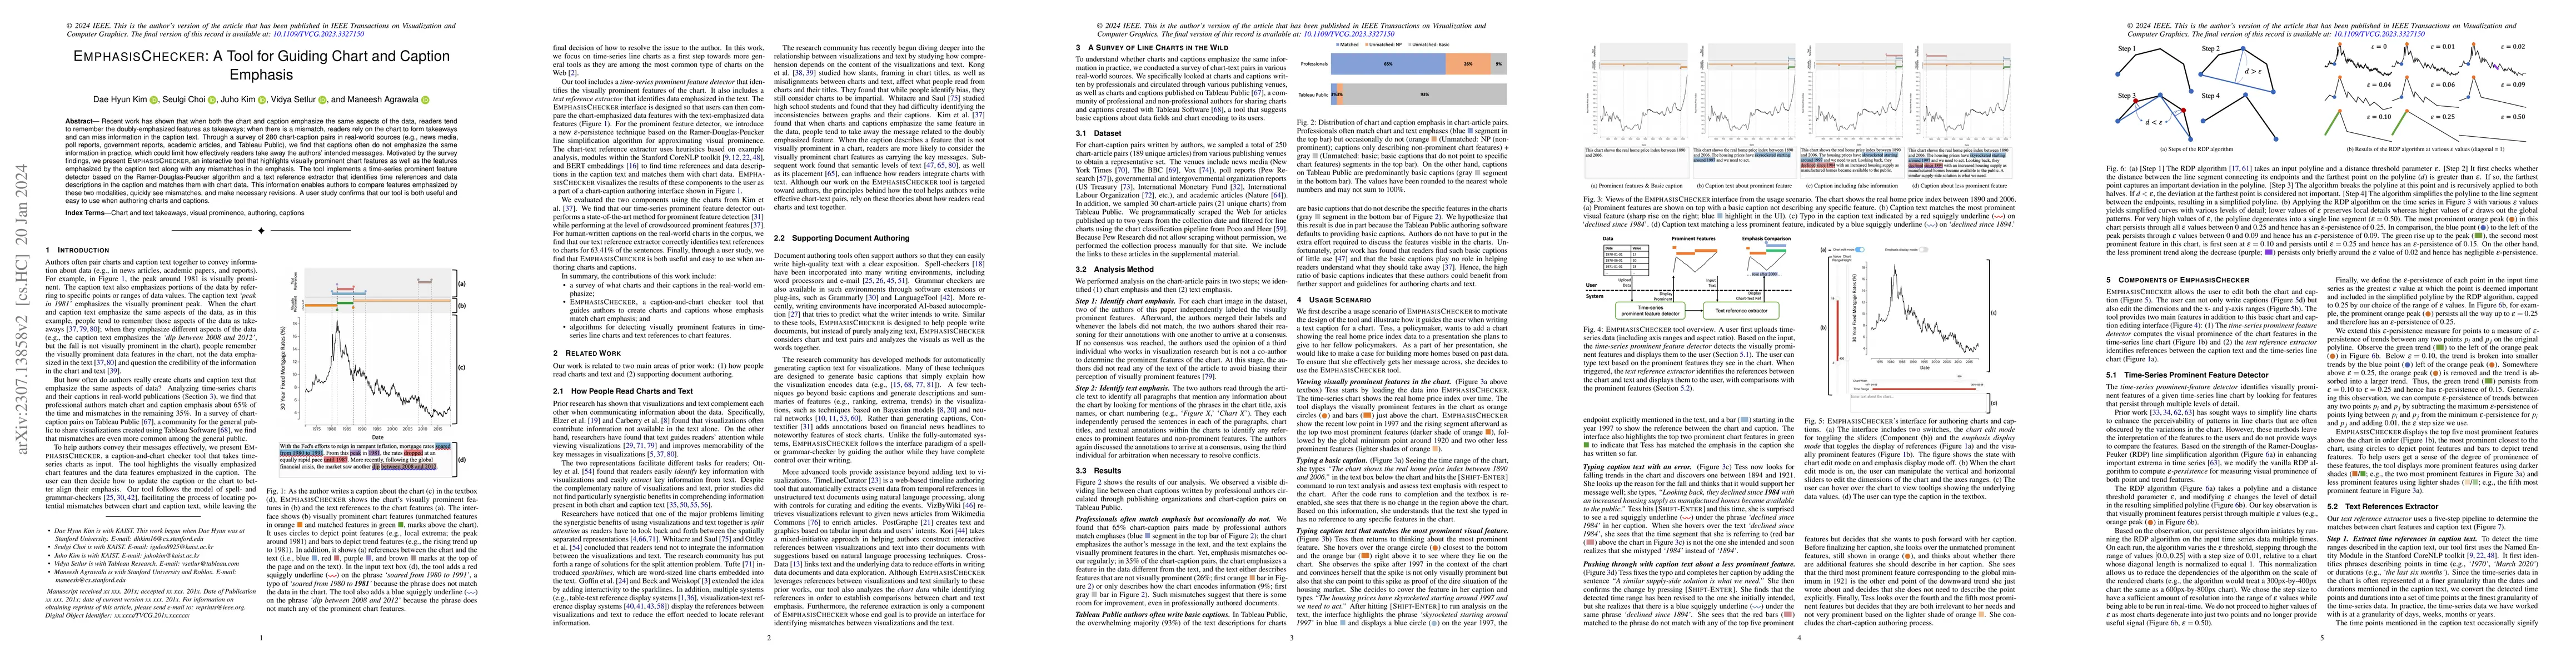
Recent work has shown that when both the chart and caption emphasize the same aspects of the data, readers tend to remember the doubly-emphasized features as takeaways; when there is a mismatch, readers rely on the chart to form takeaways and can miss information in the caption text. Through a survey of 280 chart-caption pairs in real-world sources (e.g., news media, poll reports, government reports, academic articles, and Tableau Public), we find that captions often do not emphasize the same information in practice, which could limit how effectively readers take away the authors' intended messages. Motivated by the survey findings, we present EmphasisChecker, an interactive tool that highlights visually prominent chart features as well as the features emphasized by the caption text along with any mismatches in the emphasis. The tool implements a time-series prominent feature detector based on the Ramer-Douglas-Peucker algorithm and a text reference extractor that identifies time references and data descriptions in the caption and matches them with chart data. This information enables authors to compare features emphasized by these two modalities, quickly see mismatches, and make necessary revisions. A user study confirms that our tool is both useful and easy to use when authoring charts and captions.
Get AI-generated insights about this paper's methodology, results, and significance.
Current paper (gray), citations (green), references (blue)
Shafiq Joty, Megh Thakkar, Enamul Hoque et al.
Marwan Torki, Nour Shaheen, Tamer Elsharnouby
No citations found for this paper.
Title | Authors | Year | Actions |
---|---|---|---|
Striking a Balance: Reader Takeaways and Preferences when Integrating Text and Charts
|
Chase Stokes, V. Setlur, Bridget Cogley, Arvind Satyanarayan, Marti A. Hearst
|
2022
|
View Paper |
How Do Captions Affect Visualization Reading?
|
Shelly Cheng, Hazel Zhu, Eugene Wu
|
2022
|
View Paper |
CrossData: Leveraging Text-Data Connections for Authoring Data Documents
|
Zhutian Chen, Haijun Xia
|
2022
|
View Paper |
ChartText: Linking Text with Charts in Documents
|
J. Pinheiro, Jorge Poco
|
2022
|
View Paper |
Accessible Visualization via Natural Language Descriptions: A Four-Level Model of Semantic Content
|
Alan Lundgard, Arvind Satyanarayan
|
2021
|
View Paper |
Kori: Interactive Synthesis of Text and Charts in Data Documents
|
Shahid Latif, Zhengzhong Zhou, Yoon Kim, Fabian Beck, N. Kim
|
2021
|
View Paper |
Generating Accurate Caption Units for Figure Captioning
|
Xin Qian, Eunyee Koh, F. Du, Sungchul Kim, Joel Chan, Ryan A. Rossi, Sana Malik, Tak Yeon Lee
|
2021
|
View Paper |
Towards Understanding How Readers Integrate Charts and Captions: A Case Study with Line Charts
|
Dae Hyun Kim, V. Setlur, Maneesh Agrawala
|
2021
|
View Paper |
Anaphora Resolution
|
R. Mitkov
|
2020
|
View Paper |
Chart-to-Text: Generating Natural Language Descriptions for Charts by Adapting the Transformer Model
|
Jason Obeid, Enamul Hoque
|
2020
|
View Paper |
LineSmooth: An Analytical Framework for Evaluating the Effectiveness of Smoothing Techniques on Line Charts
|
P. Rosen, Ghulam Jilani Quadri
|
2020
|
View Paper |
Language Models are Few-Shot Learners
|
Tom B. Brown, Benjamin Mann, Nick Ryder, Melanie Subbiah, J. Kaplan, Prafulla Dhariwal, Arvind Neelakantan, Pranav Shyam, Girish Sastry, Amanda Askell, Sandhini Agarwal, Ariel Herbert-Voss, Gretchen Krueger, T. Henighan, R. Child, A. Ramesh, Daniel M. Ziegler, Jeff Wu, Clemens Winter, Christopher Hesse, Mark Chen, Eric Sigler, Ma-teusz Litwin, Scott Gray, Benjamin Chess, Jack Clark, Christopher Berner, Sam McCandlish, Alec Radford, I. Sutskever, Dario Amodei
|
2020
|
View Paper |
Automatic Annotation Synchronizing with Textual Description for Visualization
|
Chufan Lai, Zhixian Lin, Ruike Jiang, Yun Han, Can Liu, Xiaoru Yuan
|
2020
|
View Paper |
The Curse of Knowledge in Visual Data Communication
|
Cindy Xiong, Lisanne Van Weelden, S. Franconeri
|
2019
|
View Paper |
Neural caption generation over figures
|
Chen Chen, Ruiyi Zhang, Sungchul Kim, Scott D. Cohen, Tong Yu, Ryan A. Rossi, Razvan C. Bunescu
|
2019
|
View Paper |
Figure Captioning with Reasoning and Sequence-Level Training
|
Charles C. Chen, Ruiyi Zhang, Eunyee Koh, Sungchul Kim, Scott D. Cohen, Tong Yu, Razvan C. Bunescu, Razvan C. Bunescu
|
2019
|
View Paper |
Trust and Recall of Information across Varying Degrees of Title-Visualization Misalignment
|
H. Kong, Zhicheng Liu, Karrie Karahalios
|
2019
|
View Paper |
Elastic Documents: Coupling Text and Tables through Contextual Visualizations for Enhanced Document Reading
|
Sriram Karthik Badam, Zhicheng Liu, N. Elmqvist
|
2019
|
View Paper |
Facilitating Document Reading by Linking Text and Tables
|
Dae Hyun Kim, Enamul Hoque, Juho Kim, Maneesh Agrawala
|
2018
|
View Paper |
Frames and Slants in Titles of Visualizations on Controversial Topics
|
H. Kong, Zhicheng Liu, Karrie Karahalios
|
2018
|
View Paper |
VizByWiki: Mining Data Visualizations from the Web to Enrich News Articles
|
Allen Yilun Lin, Joshua Ford, Eytan Adar, Brent J. Hecht
|
2018
|
View Paper |
DataSite: Proactive visual data exploration with computation of insight-based recommendations
|
Zhe Cui, Sriram Karthik Badam, Adil Yalçin, N. Elmqvist
|
2018
|
View Paper |
Beagle: Automated Extraction and Interpretation of Visualizations from the Web
|
L. Battle, Peitong Duan, Zachery Miranda, Dana Mukusheva, Remco Chang, M. Stonebraker
|
2017
|
View Paper |
Foresight: Rapid Data Exploration Through Guideposts
|
Çağatay Demiralp, P. Haas, S. Parthasarathy, Tejaswini Pedapati
|
2017
|
View Paper |
Word-Sized Graphics for Scientific Texts
|
Fabian Beck, D. Weiskopf
|
2017
|
View Paper |
Reverse‐Engineering Visualizations: Recovering Visual Encodings from Chart Images
|
Jorge Poco, Jeffrey Heer
|
2017
|
View Paper |
British Broadcasting Corporation (BBC)
|
Other Contributors Are Indicated Where They Contribute
|
2017
|
View Paper |
ASAP: Prioritizing Attention via Time Series Smoothing
|
Kexin Rong, Peter Bailis
|
2017
|
View Paper |
High School Girls’ Interpretations of Science Graphs: Exploring Complex Visual and Natural Language Hybrid Text
|
M. Whitacre, E. Saul
|
2016
|
View Paper |
Beyond Memorability: Visualization Recognition and Recall
|
M. Borkin, Z. Bylinskii, N. Kim, C. Bainbridge, Chelsea S. Yeh, Daniel Borkin, H. Pfister, A. Oliva
|
2016
|
View Paper |
TimeLineCurator: Interactive Authoring of Visual Timelines from Unstructured Text
|
Johanna Fulda, M. Brehmer, T. Munzner
|
2016
|
View Paper |
Improving Bayesian Reasoning: The Effects of Phrasing, Visualization, and Spatial Ability
|
Alvitta Ottley, Evan M. Peck, Lane Harrison, Daniel Afergan, Caroline Ziemkiewicz, H. Taylor, P. Han, Remco Chang
|
2016
|
View Paper |
Benefits of visualization in the Mammography Problem
|
Azam Khan, Simon Breslav, Michael Glueck, Kasper Hornbæk
|
2015
|
View Paper |
Design Considerations for Enhancing Word-Scale Visualizations with Interaction
|
Pascal Goffin, Wesley Willett, Jean-Daniel Fekete, Petra Isenberg
|
2015
|
View Paper |
The Stanford CoreNLP Natural Language Processing Toolkit
|
Christopher D. Manning, M. Surdeanu, John Bauer, J. Finkel, Steven Bethard, David McClosky
|
2014
|
View Paper |
M4: A Visualization-Oriented Time Series Data Aggregation
|
Uwe Jugel, Zbigniew Jerzak, Gregor Hackenbroich, V. Markl
|
2014
|
View Paper |
Extracting references between text and charts via crowdsourcing
|
Nicholas Kong, Marti A. Hearst, Maneesh Agrawala
|
2014
|
View Paper |
Contextifier: automatic generation of annotated stock visualizations
|
J. Hullman, N. Diakopoulos, Eytan Adar
|
2013
|
View Paper |
Assessing the Effect of Visualizations on Bayesian Reasoning through Crowdsourcing
|
L. Micallef, Pierre Dragicevic, Jean-Daniel Fekete
|
2012
|
View Paper |
SUTime: A library for recognizing and normalizing time expressions
|
Angel X. Chang, Christopher D. Manning
|
2012
|
View Paper |
The automated understanding of simple bar charts
|
S. Schwartz, S. Carberry, Ingrid Zukerman
|
2011
|
View Paper |
AutoVis: Automatic Visualization
|
G. Wills, Leland Wilkinson
|
2010
|
View Paper |
Information graphics: an untapped resource for digital libraries
|
S. Carberry, S. Schwartz, Seniz Demir
|
2006
|
View Paper |
Exploring and Exploiting the Limited Utility of Captions in Recognizing Intention in Information Graphics
|
S. Schwartz, S. Carberry, D. Chester, Seniz Demir, N. Green, Ingrid Zukerman, Keith Trnka
|
2005
|
View Paper |
Incorporating Non-local Information into Information Extraction Systems by Gibbs Sampling
|
J. Finkel, Trond Grenager, Christopher D. Manning
|
2005
|
View Paper |
Dimensionality Reduction for Fast Similarity Search in Large Time Series Databases
|
Eamonn J. Keogh, K. Chakrabarti, M. Pazzani, S. Mehrotra
|
2001
|
View Paper |
SUS: A 'Quick and Dirty' Usability Scale
|
J. Brooke
|
1996
|
View Paper |
Looking at the pictures.
|
Richard K. Smith
|
1990
|
View Paper |
The Shape Parameter of a Two-Variable Graph
|
W. Cleveland, Mary E. McGill, R. McGill
|
1988
|
View Paper |
The Visual Display of Quantitative Information
|
E. Tufte
|
1985
|
View Paper |
ALGORITHMS FOR THE REDUCTION OF THE NUMBER OF POINTS REQUIRED TO REPRESENT A DIGITIZED LINE OR ITS CARICATURE
|
David H. Douglas, T. Peucker
|
1973
|
View Paper |
An iterative procedure for the polygonal approximation of plane curves
|
Urs Ramer
|
1972
|
View Paper |
International Labour Organization
|
P. K. Adhikary
|
1955
|
View Paper |
The First Three Spelling Checkers
|
2023
|
||
Out-look on the Web
|
2023
|
||
Tableau Software
|
A. Veglis
|
2020
|
View Paper |
BERT: Pre-training of Deep Bidirectional Transformers for Language Understanding
|
Jacob Devlin, Ming-Wei Chang, Kenton Lee, Kristina Toutanova
|
2019
|
View Paper |
The Curious Case of Combining Text and Visualization
|
Alvitta Ottley, Aleksandra Kaszowska, R. Crouser, Evan M. Peck
|
2019
|
View Paper |
Pro-ceedings of the 2019 Conference of the North American Chapter of the Association for Computational Linguistics: Human Language Technologies, Volume 1 (Long and Short Papers)
|
2019
|
||
Exploring Interactive Linking Between Text and Visualization
|
Shahid Latif, Diao Liu, Fabian Beck
|
2018
|
View Paper |
A Fast and Accurate Dependency Parser using Neural Networks
|
Danqi Chen, Christopher D. Manning
|
2014
|
View Paper |
Visually Communicating Bayesian Statistics to Laypersons
|
Alvitta Ottley
|
2012
|
View Paper |
Towards an Understanding of
|
Hierarchical Architectures
|
2011
|
View Paper |
The Split-Attention Effect
|
J. Sweller, Paul Ayres, Slava Kalyuga
|
2011
|
View Paper |
spellcheck_dialog
|
2011
|
||
PostGraphe: A System for the Generation of Statistical Graphics and Text
|
Massimo Fasciano, G. Lapalme
|
1996
|
View Paper |
The United Nations
|
L. Fagerlund
|
1993
|
View Paper |
The graph as a victim of adverse discrimination and segregation: Comment occasioned by the first issue of information design journal
|
A. Biderman
|
1979
|
View Paper |
LibreOffice
|
|||
This is the author’s version of the article
|
|||
Fix Spelling & Grammar as You Type in Gmail
|
|||
Checking Spelling and Grammar
|
|||
Editor Settings
|
|||
Use Smart Compose
|
|||
Check Your Spelling & Grammar in Google Docs
|
Showing first page preview. Click "Open Full PDF" to view the complete paper.
Your comment contains inappropriate language and has been rejected.
Are you sure you want to remove this tag? This action cannot be undone.
Someone just favorited a paper!
Comments (0)