Authors
Summary
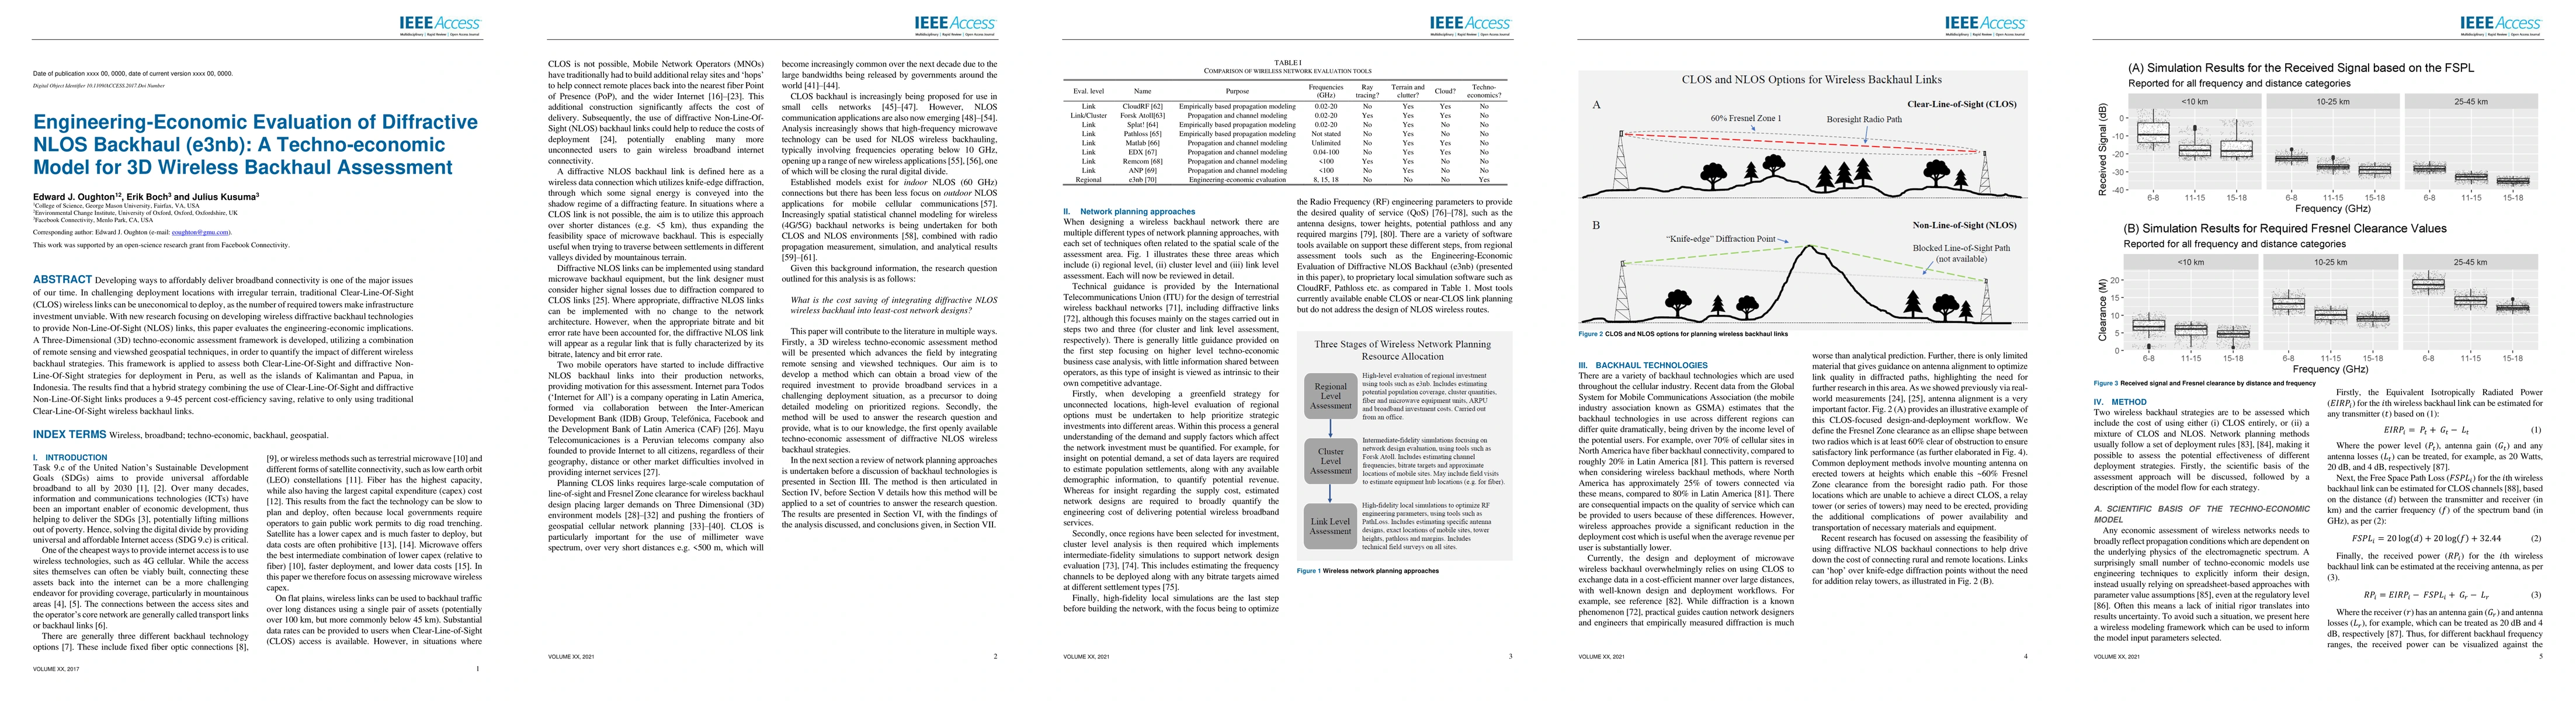
Developing ways to affordably deliver broadband connectivity is one of the major issues of our time. In challenging deployment locations with irregular terrain, traditional Clear-Line-Of-Sight (CLOS) wireless links can be uneconomical to deploy, as the number of required towers make infrastructure investment unviable. With new research focusing on developing wireless diffractive backhaul technologies to provide Non-Line-Of-Sight (NLOS) links, this paper evaluates the engineering-economic implications. A Three-Dimensional (3D) techno-economic assessment framework is developed, utilizing a combination of remote sensing and viewshed geospatial techniques, in order to quantify the impact of different wireless backhaul strategies. This framework is applied to assess both Clear-Line-Of-Sight and diffractive Non-Line-Of-Sight strategies for deployment in Peru, as well as the islands of Kalimantan and Papua, in Indonesia. The results find that a hybrid strategy combining the use of Clear-Line-Of-Sight and diffractive Non-Line-Of-Sight links produces a 9-45 percent cost-efficiency saving, relative to only using traditional Clear-Line-Of-Sight wireless backhaul links.
AI Key Findings
Get AI-generated insights about this paper's methodology, results, and significance.
Paper Details
PDF Preview
Key Terms
Citation Network
Current paper (gray), citations (green), references (blue)
Display is limited for performance on very large graphs.
No citations found for this paper.
Comments (0)