Publication
Metrics
AI Quick Summary
This study explores advanced data visualization techniques to enhance situational awareness in AI-driven surveillance, focusing on real-world applications in a community college. It introduces tools like Occupancy Indicators and Heatmaps to convert complex video analytics into actionable insights, emphasizing their impact on safety, urban planning, and decision-making.
Paper Preview
Abstract
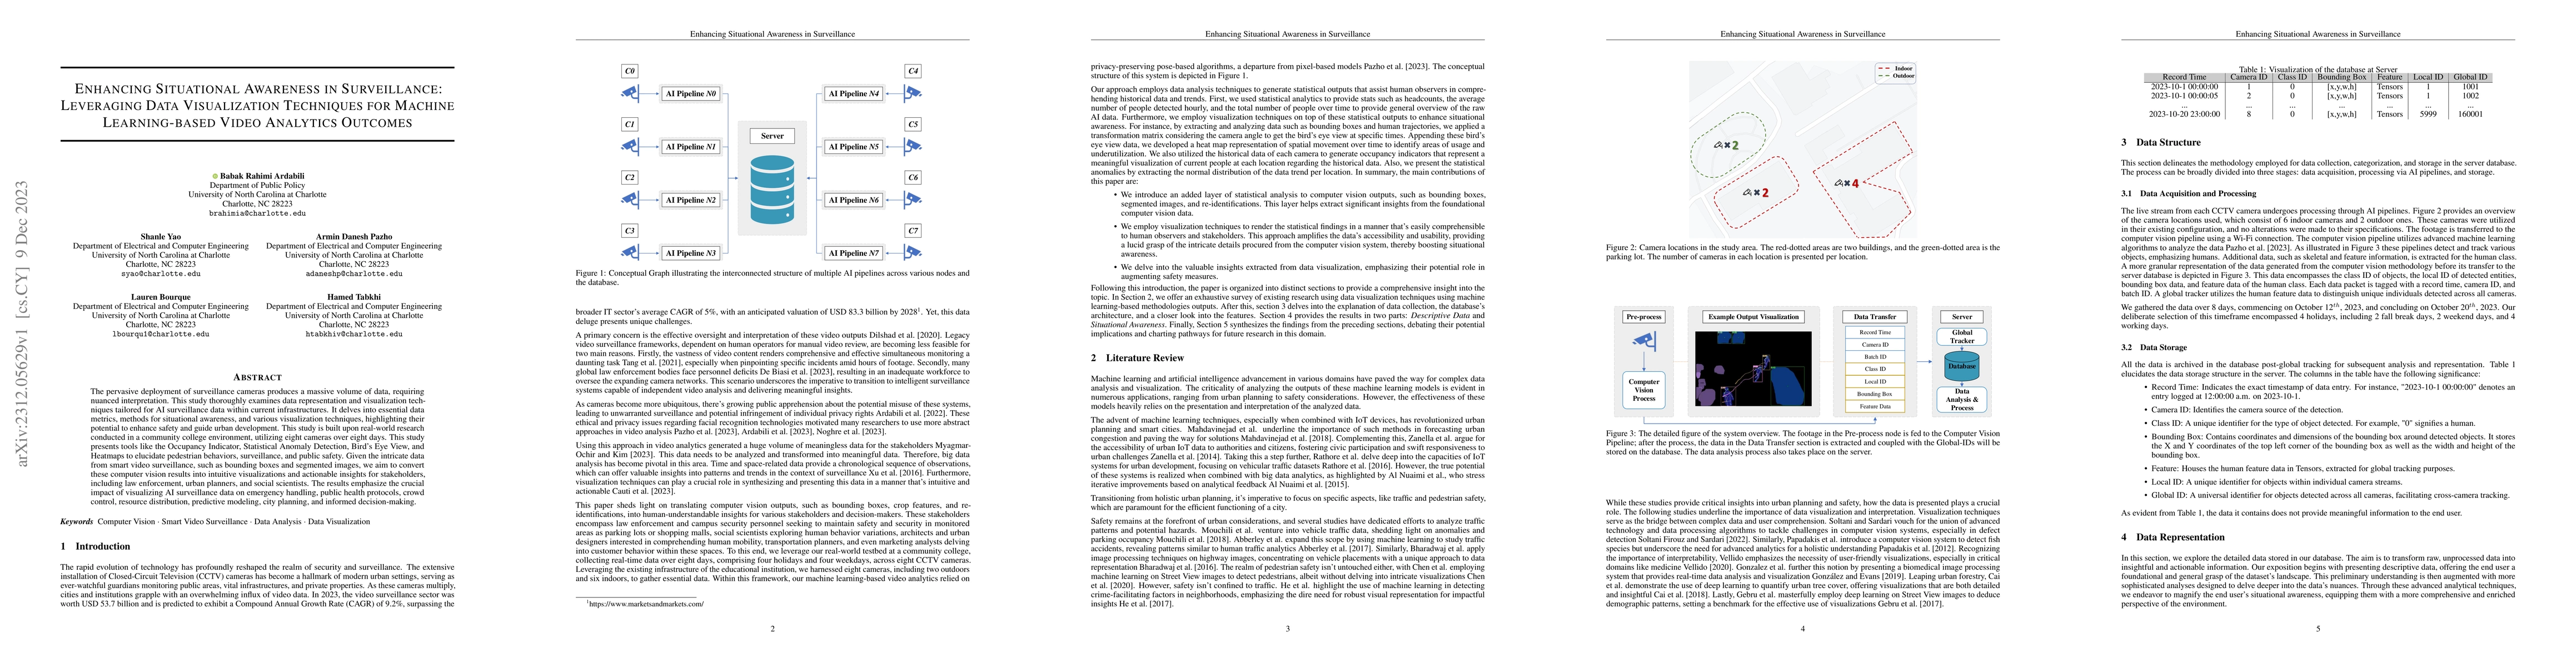
The pervasive deployment of surveillance cameras produces a massive volume of data, requiring nuanced interpretation. This study thoroughly examines data representation and visualization techniques tailored for AI surveillance data within current infrastructures. It delves into essential data metrics, methods for situational awareness, and various visualization techniques, highlighting their potential to enhance safety and guide urban development. This study is built upon real-world research conducted in a community college environment, utilizing eight cameras over eight days. This study presents tools like the Occupancy Indicator, Statistical Anomaly Detection, Bird's Eye View, and Heatmaps to elucidate pedestrian behaviors, surveillance, and public safety. Given the intricate data from smart video surveillance, such as bounding boxes and segmented images, we aim to convert these computer vision results into intuitive visualizations and actionable insights for stakeholders, including law enforcement, urban planners, and social scientists. The results emphasize the crucial impact of visualizing AI surveillance data on emergency handling, public health protocols, crowd control, resource distribution, predictive modeling, city planning, and informed decision-making.
AI Key Findings
Get AI-generated insights about this paper's methodology, results, significance, and more — seven facets brought into focus.
Impact
Paper Details
Authors
PDF Preview
Key Terms
Citation Network
Current paper (gray), citations (green), references (blue)
Display is limited for performance on very large graphs.
Discussion 0