ESID: Exploring the Design and Development of a Visual Analytics Tool for Epidemiological Emergencies
Publication
Metrics
AI Quick Summary
This paper details the design and development of ESID, a visual analytics tool for projecting infectious disease spread using mathematical models. The tool was developed through a collaborative approach involving diverse scientific fields, focusing on user-centric design to enhance intuitiveness and effectiveness.
Paper Preview
Abstract
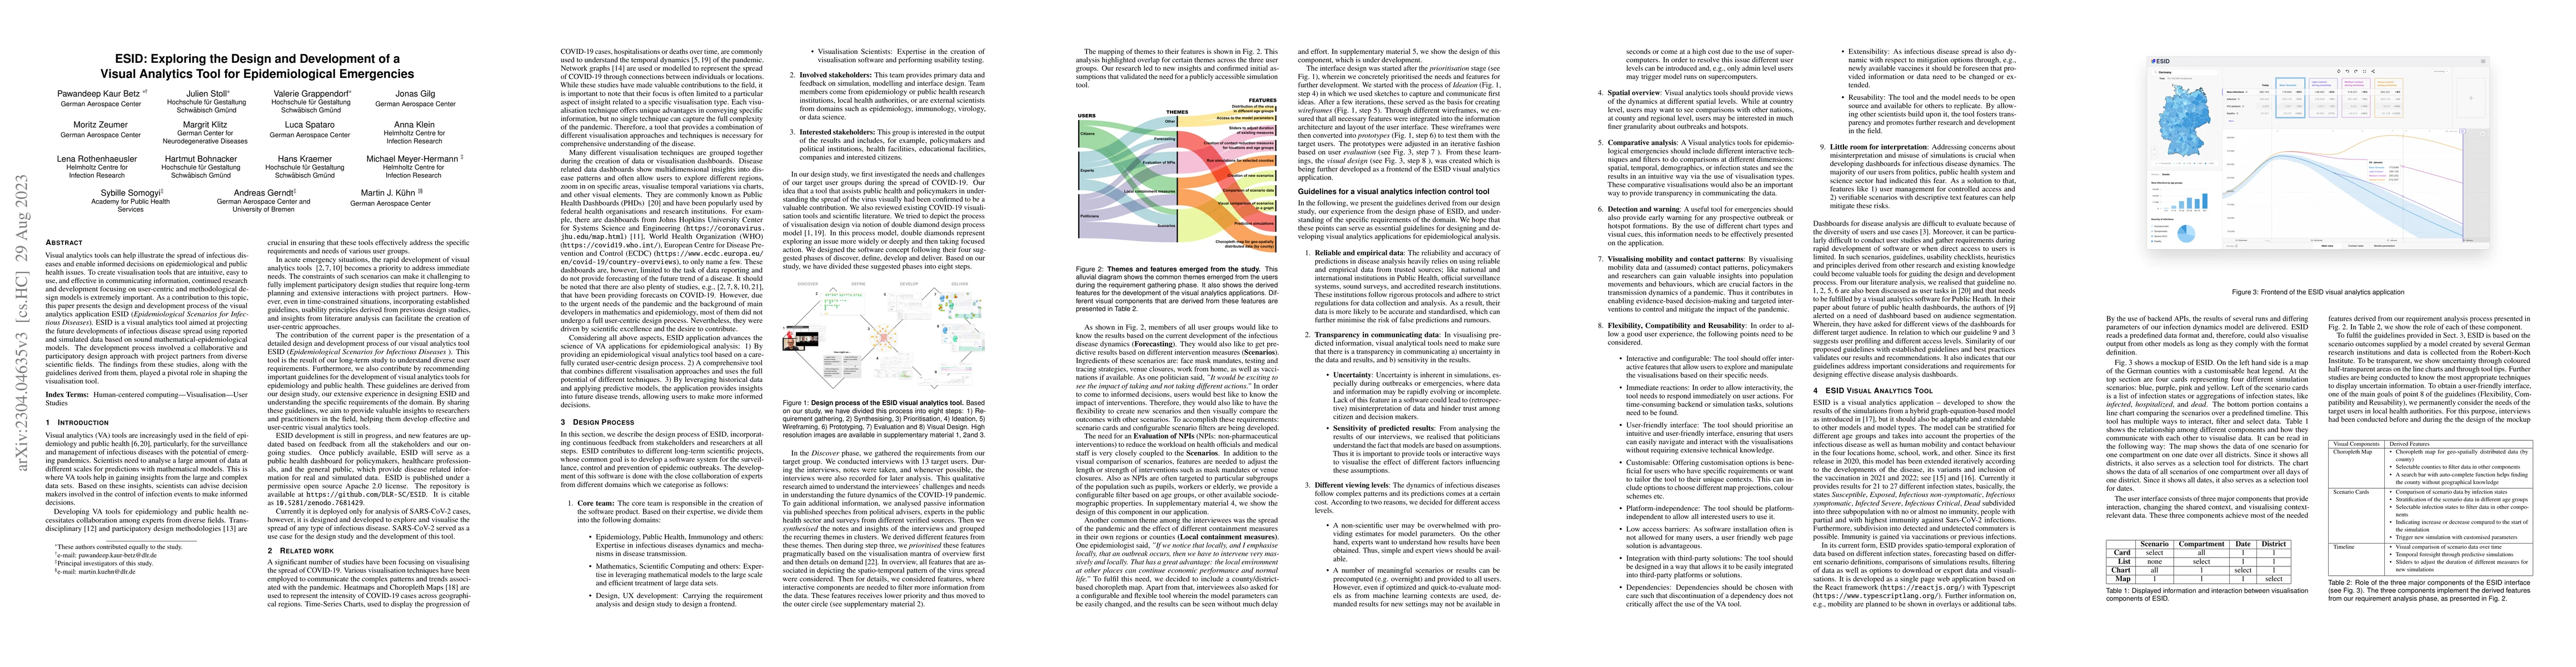
Visual analytics tools can help illustrate the spread of infectious diseases and enable informed decisions on epidemiological and public health issues. To create visualisation tools that are intuitive, easy to use, and effective in communicating information, continued research and development focusing on user-centric and methodological design models is extremely important. As a contribution to this topic, this paper presents the design and development process of the visual analytics application ESID (Epidemiological Scenarios for Infectious Diseases). ESID is a visual analytics tool aimed at projecting the future developments of infectious disease spread using reported and simulated data based on sound mathematical-epidemiological models. The development process involved a collaborative and participatory design approach with project partners from diverse scientific fields. The findings from these studies, along with the guidelines derived from them, played a pivotal role in shaping the visualisation tool.
AI Key Findings
Get AI-generated insights about this paper's methodology, results, significance, and more — seven facets brought into focus.
Impact
Paper Details
Authors
PDF Preview
Key Terms
Citation Network
Current paper (gray), citations (green), references (blue)
Display is limited for performance on very large graphs.
Discussion 0