ClinicLens is an interactive visual analytics system designed to help optimize clinic testing capacities during pandemics like COVID-19, addressing the complexities and uncertainties involved. It combines AI4VIS and visual analytics to provide insights into optimizing testing features, validated through qualitative case studies and expert feedback.
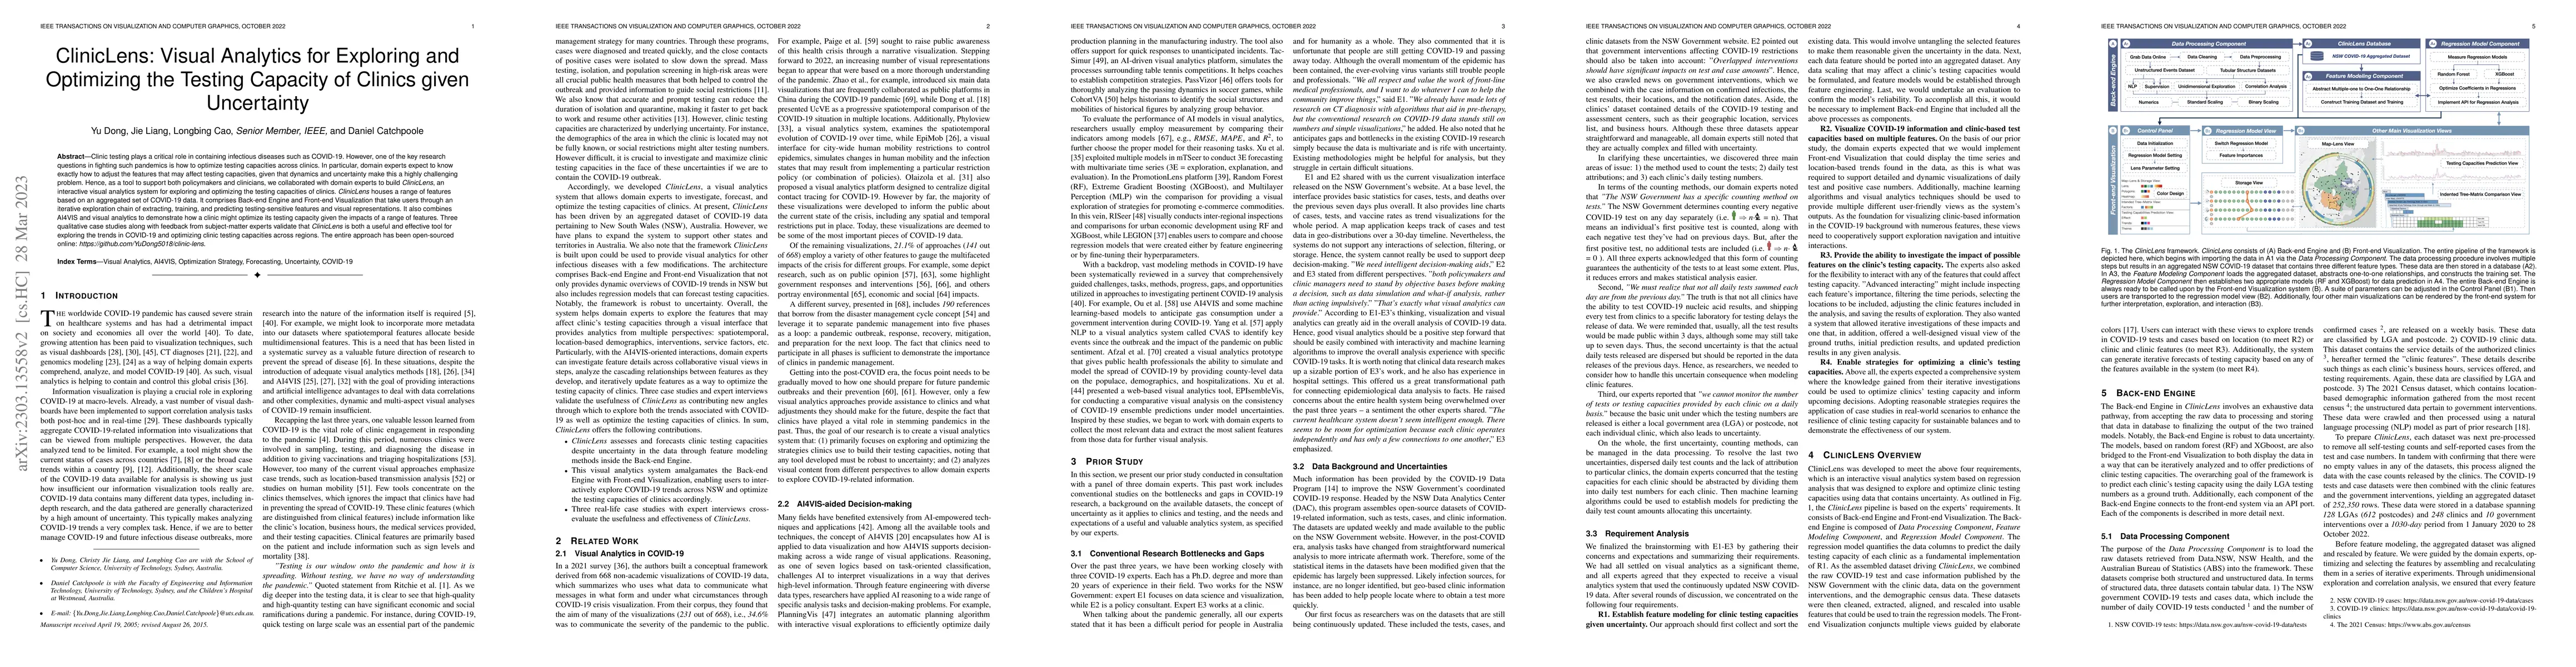
Clinic testing plays a critical role in containing infectious diseases such as COVID-19. However, one of the key research questions in fighting such pandemics is how to optimize testing capacities across clinics. In particular, domain experts expect to know exactly how to adjust the features that may affect testing capacities, given that dynamics and uncertainty make this a highly challenging problem. Hence, as a tool to support both policymakers and clinicians, we collaborated with domain experts to build ClinicLens, an interactive visual analytics system for exploring and optimizing the testing capacities of clinics. ClinicLens houses a range of features based on an aggregated set of COVID-19 data. It comprises Back-end Engine and Front-end Visualization that take users through an iterative exploration chain of extracting, training, and predicting testing-sensitive features and visual representations. It also combines AI4VIS and visual analytics to demonstrate how a clinic might optimize its testing capacity given the impacts of a range of features. Three qualitative case studies along with feedback from subject-matter experts validate that ClinicLens is both a useful and effective tool for exploring the trends in COVID-19 and optimizing clinic testing capacities across regions. The entire approach has been open-sourced online: https://github.com/YuDong5018/clinic-lens.
This graph shows how this paper is connected to other research. The current paper is shown in dark gray, papers that cite it are in green, and papers it references are in blue. You can:
• Hover over any node to see the paper title
• Click a node to view that paper's details
• Drag nodes to rearrange the graph
• Use the zoom controls (bottom right) to zoom in/out
No citations found for this paper.
Title | Authors | Year | Actions |
---|---|---|---|
Practical Machine Learning
|
Ally S. Nyamawe, Mohamedi M. Mjahidi, Noe E. Nnko, Salim Diwani, Godbless G. Minja, Kulwa Malyango
|
2025
|
View Paper |
Smart Visual Sensing for Overcrowding in COVID-19 Infected Cities Using Modified Deep Transfer Learning
|
Khosro Rezaee, Hossein Ghayoumi Zadeh, Chinmay Chakraborty, Mohammad Hossein Khosravi, Gwanggil Jeon
|
2023
|
View Paper |
Visual Analytics Platform for Centralized COVID-19 Digital Contact Tracing
|
Igor García Olaizola, J. L. Bruse, J. Odriozola, Arkaitz Artetxe, David Velásquez, M. Quartulli, Jorge Posada
|
2022
|
View Paper |
A Multiscale Geospatial Dataset and an Interactive Visualization Dashboard for Computational Epidemiology and Open Scientific Research
|
Muhammad Usman, Honglu Zhou, Seonghyeon Moon, Xun Zhang, P. Faloutsos, M. Kapadia
|
2022
|
View Paper |
A Survey on Data-driven COVID-19 and Future Pandemic Management
|
Yudong Tao, Chuang Yang, Tianyi Wang, Erik Coltey, Yanxiu Jin, Yinghao Liu, Renhe Jiang, Z. Fan, Xuan Song, R. Shibasaki, Shu-Ching Chen, Mei-Ling Shyu, Steven Luis
|
2022
|
View Paper |
Deploying geospatial visualization dashboards to combat the socioeconomic impacts of COVID-19
|
S. Praharaj, P. Solís, E. Wentz
|
2022
|
View Paper |
User-centered visual explorer of in-process comparison in spatiotemporal space
|
Dong Yu, Ian Oppermann, Jie Liang, Xiaoru Yuan, Nguyen Quang Vinh
|
2022
|
View Paper |
ColorCook: Augmenting Color Design for Dashboarding with Domain-Associated Palettes
|
Yang Shi, Siji Chen, Pei Liu, Jiang Long, Nan Cao
|
2022
|
View Paper |
A survey of urban visual analytics: Advances and future directions
|
Zikun Deng, Di Weng, Shuhan Liu, Yuan Tian, Mingliang Xu, Yingnian Wu
|
2022
|
View Paper |
New rules for genomics-informed COVID-19 responses–Lessons learned from the first waves of the Omicron variant in Australia
|
A. Porter, N. Sherry, Patiyan Andersson, S. A. Johnson, S. Duchêne, B. Howden
|
2022
|
View Paper |
Multiple Forecast Visualizations (MFVs): Trade-offs in Trust and Performance in Multiple COVID-19 Forecast Visualizations
|
Lace M. K. Padilla, Racquel Fygenson, Spencer C. Castro, E. Bertini
|
2022
|
View Paper |
October 2022
|
A. H. Moffitt
|
2022
|
View Paper |
CohortVA: A Visual Analytic System for Interactive Exploration of Cohorts based on Historical Data
|
Wei Zhang, Jason K. Wong, Xumeng Wang, Youcheng Gong, Rongchen Zhu, Kai Liu, Zihan Yan, Siwei Tan, Huamin Qu, Siming Chen, Wei Chen
|
2022
|
View Paper |
RISeer: Inspecting the Status and Dynamics of Regional Industrial Structure via Visual Analytics
|
Long-fei Chen, Yang Ouyang, Haipeng Zhang, Suting Hong, Quan Li
|
2022
|
View Paper |
PromotionLens: Inspecting Promotion Strategies of Online E-commerce via Visual Analytics
|
Chenyang Zhang, Xiyuan Wang, Chuyi Zhao, Yijing Ren, Tianyu Zhang, Zhenhui Peng, Xiaomeng Fan, Xiaojuan Ma, Qu Li
|
2022
|
View Paper |
Visualization Design Practices in a Crisis: Behind the Scenes with COVID-19 Dashboard Creators
|
Yixuan Zhang, Yifan Sun, Joseph D. Gaggiano, Neha Kumar, Clio Andris, Andrea G. Parker
|
2022
|
View Paper |
PhyloView: A System to Visualize the Ecology of Infectious Diseases Using Phylogenetic Data
|
M. T. Le, D. Attaway, T. Anderson, H. Kavak, A. Roess, Andreas Züfle
|
2022
|
View Paper |
Uncovering chains of infections through spatio-temporal and visual analysis of COVID-19 contact traces
|
D. Antweiler, D. Sessler, Maxim Rossknecht, Benjamin Abb, S. Ginzel, J. Kohlhammer
|
2022
|
View Paper |
Costing of an Australian general practice COVID-19 drive-through testing and respiratory clinic
|
P. Abraham, J. Manski-Nankervis, Ruby Biezen, C. Hallinan, K. Gibney, L. Sanci, J. Ride
|
2022
|
View Paper |
CVAS: An Interactive Visual Analytics System for Exploring COVID-19 Information on the Web
|
Tao Yang, Yixuan Zhou, Danghong Feng, Haibo Hu
|
2022
|
View Paper |
Studying the post-COVID-19 condition: research challenges, strategies, and importance of Core Outcome Set development
|
D. Munblit, T. Nicholson, D. Needham, N. Seylanova, Callum Parr, Jessica Chen, Alisa Kokorina, L. Sigfrid, D. Buonsenso, S. Bhatnagar, R. Thiruvengadam, Ann M. Parker, J. Preller, S. Avdeev, F. Klok, Allison Tong, Janet Diaz, W. D. Groote, N. Schiess, A. Akrami, Frances K Simpson, P. Olliaro, C. Apfelbacher, R. Rosa, J. Chevinsky, S. Saydah, J. Schmitt, A. Guekht, S. Gorst, J. Genuneit, L. Reyes, Alan Asmanov, M. O'Hara, J. Scott, M. Michelen, C. Stavropoulou, J. Warner, M. Herridge, P. Williamson
|
2022
|
View Paper |
Visualization as infrastructure: China’s data visualization politics during COVID-19 and their implications for public health emergencies
|
Luming Zhao, WeiMing Ye
|
2022
|
View Paper |
COVID-GAN+: Estimating Human Mobility Responses to COVID-19 through Spatio-temporal Generative Adversarial Networks with Enhanced Features
|
Han Bao, Xun Zhou, Yiqun Xie, Yingxue Zhang, Yanhua Li
|
2022
|
View Paper |
A New Age of AI: Features and Futures
|
Longbing Cao, M. Wooldridge
|
2022
|
View Paper |
EPIsembleVis: A geo-visual analysis and comparison of the prediction ensembles of multiple COVID-19 models
|
Haowen Xu, A. Berres, Gautam S. Thakur, J. Sanyal, S. Chinthavali
|
2021
|
View Paper |
Neo: Generalizing Confusion Matrix Visualization to Hierarchical and Multi-Output Labels
|
Jochen Gortler, Fred Hohman, Dominik Moritz, Kanit Wongsuphasawat, Donghao Ren, Rahul Nair, Marc Kirchner, Kayur Patel
|
2021
|
View Paper |
Gosling: A Grammar-based Toolkit for Scalable and Interactive Genomics Data Visualization
|
S. L’Yi, Qianwen Wang, Fritz Lekschas, Nils Gehlenborg
|
2021
|
View Paper |
Modeling time evolving COVID-19 uncertainties with density dependent asymptomatic infections and social reinforcement
|
Qing Liu, Longbing Cao
|
2021
|
View Paper |
COVID ISSUE: Visual Narratives About COVID-19 Improve Message Accessibility, Self-Efficacy, and Health Precautions
|
P. Jarreau, Leona Yi-Fan Su, Elfy Chun-Lin Chiang, Shauna M. Bennett, J. S. Zhang, Matt Ferguson, Doryan Algarra
|
2021
|
View Paper |
Medical-VLBERT: Medical Visual Language BERT for COVID-19 CT Report Generation With Alternate Learning
|
Guangyi Liu, Yinghong Liao, Fuyu Wang, Bin Zhang, Lu Zhang, Xiaodan Liang, Xiang Wan, Shaolin Li, Zhen Li, Shuixing Zhang, Shuguang Cui
|
2021
|
View Paper |
COVID-view: Diagnosis of COVID-19 using Chest CT
|
Shreeraj Jadhav, Gaofeng Deng, M. Zawin, A. Kaufman
|
2021
|
View Paper |
Implicit Error, Uncertainty and Confidence in Visualization: An Archaeological Case Study
|
Georgia Panagiotidou, R. Vandam, J. Poblome, A. Moere
|
2021
|
View Paper |
mTSeer: Interactive Visual Exploration of Models on Multivariate Time-series Forecast
|
Ke Xu, Jun Yuan, Yifang Wang, Cláudio T. Silva, E. Bertini
|
2021
|
View Paper |
COVID-19 Modeling: A Review
|
Longbing Cao, Qing Liu, Wenfeng Hou
|
2021
|
View Paper |
A global database of COVID-19 vaccinations
|
E. Mathieu, Hannah Ritchie, Esteban Ortiz-Ospina, Max Roser, Joe Hasell, Cameron Appel, Charlie Giattino, Lucas Rodés-Guirao
|
2021
|
View Paper |
A global panel database of pandemic policies (Oxford COVID-19 Government Response Tracker)
|
Thomas Hale, Noam Angrist, Rafael Goldszmidt, B. Kira, A. Petherick, Toby Phillips, Samuel Webster, Emily Cameron-Blake, L. Hallas, S. Majumdar, Helen Tatlow
|
2021
|
View Paper |
A Conceptual Model for Geo-Online Exploratory Data Visualization: The Case of the COVID-19 Pandemic
|
A. Bernasconi, S. Grandi
|
2021
|
View Paper |
AI4VIS: Survey on Artificial Intelligence Approaches for Data Visualization
|
Aoyu Wu, Yun Wang, Xinhuan Shu, Dominik Moritz, Weiwei Cui, Haidong Zhang, Dongmei Zhang, Huamin Qu
|
2021
|
View Paper |
COVIDSenti: A Large-Scale Benchmark Twitter Data Set for COVID-19 Sentiment Analysis
|
Usman Naseem, Imran Razzak, Matloob Khushi, Peter W. Eklund, Jinman Kim
|
2021
|
View Paper |
Detection of Phenotype-Related Mutations of COVID-19 via the Whole Genomic Data
|
Jin-Xiong Lv, Shikui Tu, Lei Xu
|
2021
|
View Paper |
Using Animation to Visualize Spatio-Temporal Varying COVID-19 Data
|
H. Samet, Yunheng Han, J. Kastner, Hong Wei
|
2020
|
View Paper |
Post-pandemic transformations: How and why COVID-19 requires us to rethink development
|
M. Leach, H. MacGregor, I. Scoones, Annie Wilkinson
|
2020
|
View Paper |
Erratum: Author Correction: Machine learning model to project the impact of COVID-19 on US motor gasoline demand.
|
Shiqi Ou, Xin He, Weiqi Ji, Wei Chen, Lang Sui, Yu Gan, Zifeng Lu, Zhenhong Lin, Sili Deng, Steven Przesmitzki, Jessey Bouchard
|
2020
|
View Paper |
Coronavirus disease-19 in environmental fields: a bibliometric and visualization mapping analysis
|
S. Zyoud, A. Zyoud
|
2020
|
View Paper |
COVIs: Supporting Temporal Visual Analysis of Covid-19 Events Usable in Data-Driven Journalism
|
R. Leite, V. Schetinger, D. Ceneda, Bernardo Henz, S. Miksch
|
2020
|
View Paper |
LEGION: Visually compare modeling techniques for regression
|
Subhajit Das, A. Endert
|
2020
|
View Paper |
A Visual Analytics Based Decision Making Environment for COVID-19 Modeling and Visualization
|
S. Afzal, Sohaib Ghani, H. Jenkins‐Smith, David Ebert, Markus Hadwiger, I. Hoteit
|
2020
|
View Paper |
Clinical features of COVID-19 mortality: development and validation of a clinical prediction model
|
A. S. Yadaw, Yan-Chak Li, S. Bose, Ravi Iyengar, S. Bunyavanich, G. Pandey
|
2020
|
View Paper |
PassVizor: Toward Better Understanding of the Dynamics of Soccer Passes
|
Xiao Xie, Jiachen Wang, Hongye Liang, Dazhen Deng, Shoubin Cheng, Hui Zhang, Wei Chen, Yingcai Wu
|
2020
|
View Paper |
Mapping the Landscape of COVID-19 Crisis Visualizations
|
Yixuan Zhang, Yifan Sun, Lace M. K. Padilla, Sumit Barua, E. Bertini, A. Parker
|
2020
|
View Paper |
EpiMob: Interactive Visual Analytics of CitywideHuman Mobility Restrictions for Epidemic Control
|
Zhiwen Zhang, Chuang Yang, Z. Fan, Renhe Jiang, Quanjun Chen, Xuan Song, R. Shibasaki
|
2020
|
View Paper |
Case isolation, contact tracing, and physical distancing are pillars of COVID-19 pandemic control, not optional choices
|
C. Macintyre
|
2020
|
View Paper |
GTMapLens: Interactive Lens for Geo‐Text Data Browsing on Map
|
Chao Ma, Ye Zhao, Shamal Al-Dohuki, Jing Yang, X. Ye, Farah Kamw, Md Amiruzzaman
|
2020
|
View Paper |
Coronavirus Pandemic (COVID-19)
|
Max Roser, Hannah Ritchie, Esteban Ortiz-Ospina, Joe Hasell
|
2020
|
View Paper |
Australian Quarantine Policy: From Centralization to Coordination with Mid‐Pandemic COVID‐19 Shifts
|
K. Moloney, S. Moloney
|
2020
|
View Paper |
Using Social Media to Mine and Analyze Public Opinion Related to COVID-19 in China
|
Xuehua Han, Juanle Wang, Min Zhang, Xiaojie Wang
|
2020
|
View Paper |
An interactive web-based dashboard to track COVID-19 in real time
|
E. Dong, H. Du, L. Gardner
|
2020
|
View Paper |
Tac-Simur: Tactic-based Simulative Visual Analytics of Table Tennis
|
Jiachen Wang, K. Zhao, Dazhen Deng, Anqi Cao, Xiao Xie, Zheng Zhou, Hui Zhang, Yingcai Wu
|
2020
|
View Paper |
PlanningVis: A Visual Analytics Approach to Production Planning in Smart Factories
|
Dong Sun, Renfei Huang, Yuanzhe Chen, Yong Wang, Jia Zeng, Mingxuan Yuan, T. Pong, Huamin Qu
|
2019
|
View Paper |
Data Science Thinking: The Next Scientific, Technological and Economic Revolution
|
Longbing Cao
|
2018
|
View Paper |
Data-Driven Techniques in Disaster Information Management
|
Tao Li, Ning Xie, Chunqiu Zeng, Wubai Zhou, Li Zheng, Yexi Jiang, Yimin Yang, Hsin-Yu Ha, Wei Xue, Yue Huang, Shu‐Ching Chen, J. Navlakha, S. S. Iyengar
|
2017
|
View Paper |
D³ Data-Driven Documents
|
M. Bostock, Vadim Ogievetsky, Jeffrey Heer
|
2011
|
View Paper |
Node.js: Using JavaScript to Build High-Performance Network Programs
|
Stefan Tilkov, S. Vinoski
|
2010
|
View Paper |
Interactive Analysis of Epidemic Situations Based on a Spatiotemporal Information Knowledge Graph of COVID-19
|
B. Jiang, Xiong You, Kelvin K. F. Li, Tingting Li, Xiaojun Zhou, Liheng Tan
|
2022
|
View Paper |
the COVID-19 at the
|
2022
|
View Paper | |
WHO Coronavirus Disease (COVID-19) Dashboard
|
C. E.
|
2020
|
View Paper |
Why covid-19 testing is the key to getting back to normal
|
2020
|
||
Visual Analytics
|
O. Deussen, Thomas Ertl, D. Keim
|
2010
|
View Paper |
Coronavirus (covid-19) case numbers and statistics
|
|||
Nsw government covid-19 data program
|
|||
visualization from the University of Technology, Sydney, and now leads the Data Visualization Research Lab in the Visualization Institute at UTS
|
|||
Laboratory testing strategy recommendations for covid-19: interim guidance
|
Showing first page preview. Click "Open Full PDF" to view the complete paper.
Mohamed Amine Chatti, Mouadh Guesmi, Arham Muslim, Manpriya Guliani
Published: 2023-03-23
Michael Meyer-Hermann, Martin J. Kühn, Andreas Gerndt, Pawandeep Kaur Betz, Jonas Gilg, Moritz Zeumer, Anna Klein, Julien Stoll, Valerie Grappendorf, Margrit Klitz, Luca Spataro, Lena Rothenhäusler, Hartmut Bohnacker, Hans Krämer, Sybille Somogyi
Published: 2023-08-30
You need to log in to post a comment.
Your comment contains inappropriate language.
Are you sure you want to remove this tag?
Someone just favorited a paper!
Comments (0)