Authors
Summary
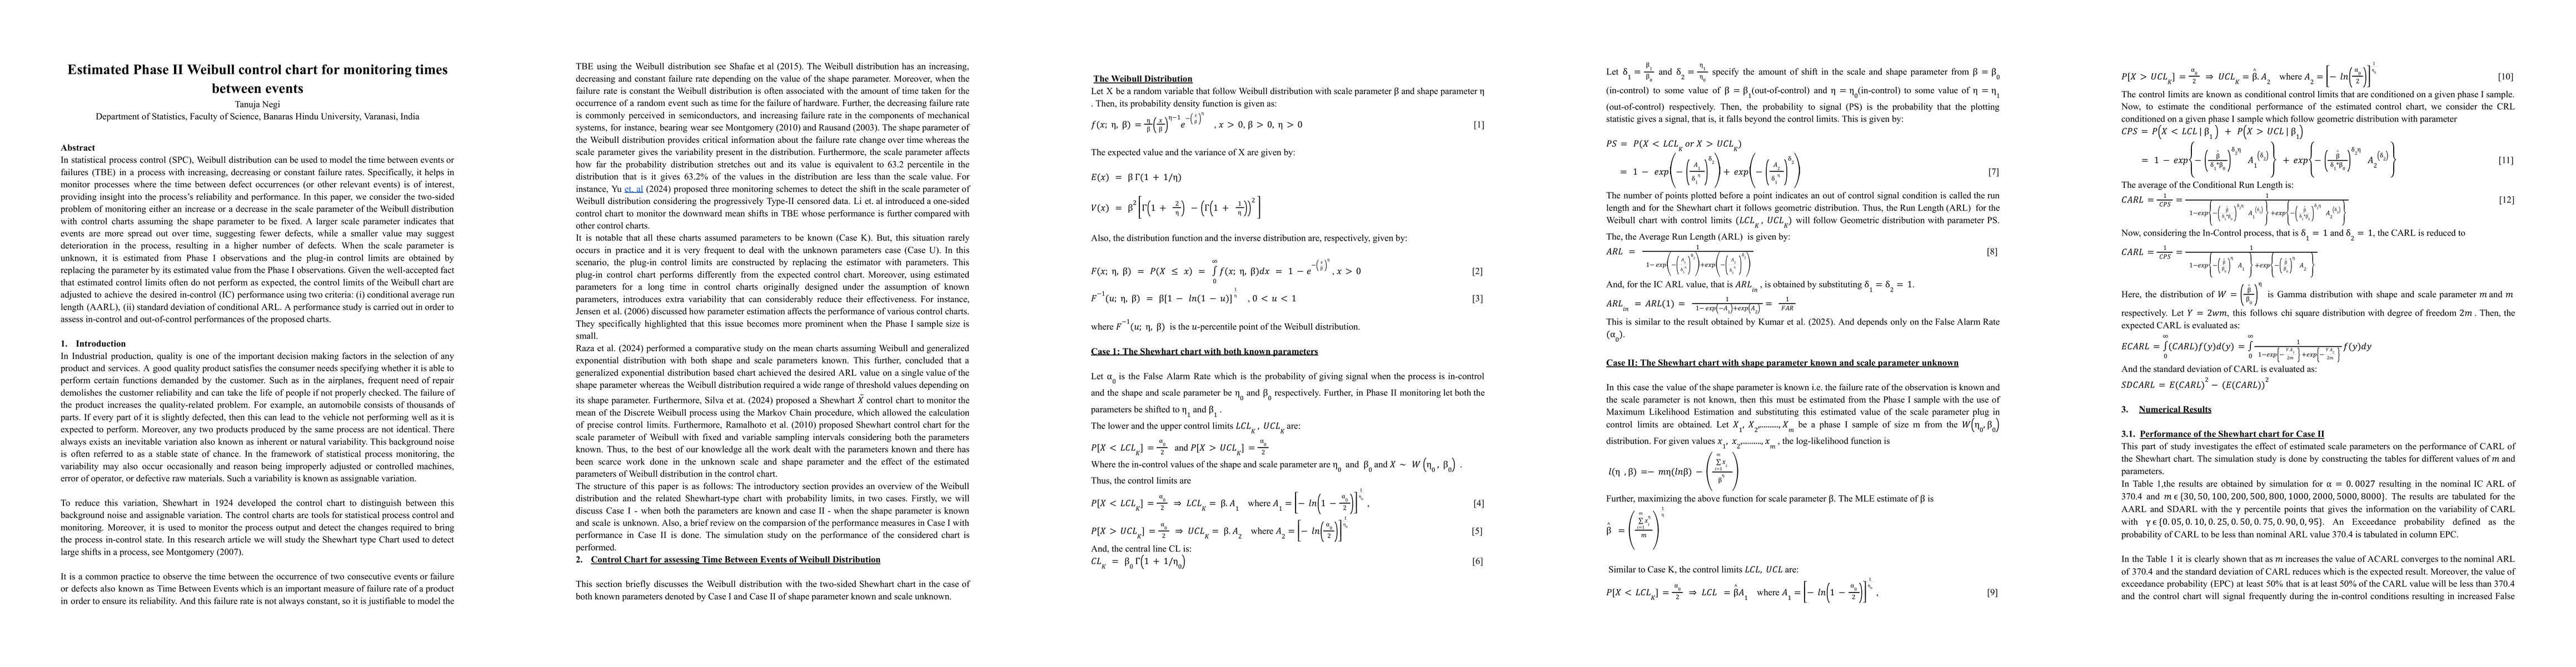
In statistical process control Weibull distribution can be used to model the time between events or failures (TBE) in a process with increasing decreasing or constant failure rates. Specifically it helps in monitoring processes where the time between defect occurrences is of interest providing insight into the process reliability and performance. In this paper we consider the two sided problem of monitoring either an increase or a decrease in the scale parameter of the Weibull distribution with control charts assuming the shape parameter to be fixed. A larger scale parameter indicates that events are more spread out over time suggesting fewer defects while a smaller value may suggest deterioration in the process resulting in a higher number of defects. When the scale parameter is unknown it is estimated from Phase I observations and the plug in control limits are obtained by replacing the parameter by its estimated value from the Phase I observations. Given the well accepted fact that estimated control limits often do not perform as expected, the control limits of the Weibull chart are adjusted to achieve the desired in control (IC) performance using two criteria that are conditional average run length and standard deviation of conditional ARL. A performance study is carried out in order to assess in control and out of control performances of the proposed charts.
AI Key Findings
Get AI-generated insights about this paper's methodology, results, and significance.
Paper Details
PDF Preview
Similar Papers
Found 4 papersControl Chart for Generalized Weibull Quantiles under Hybrid Censoring
Amarjit Kundu, Shovan Chowdhury, Bidhan Modok
Comments (0)