Summary
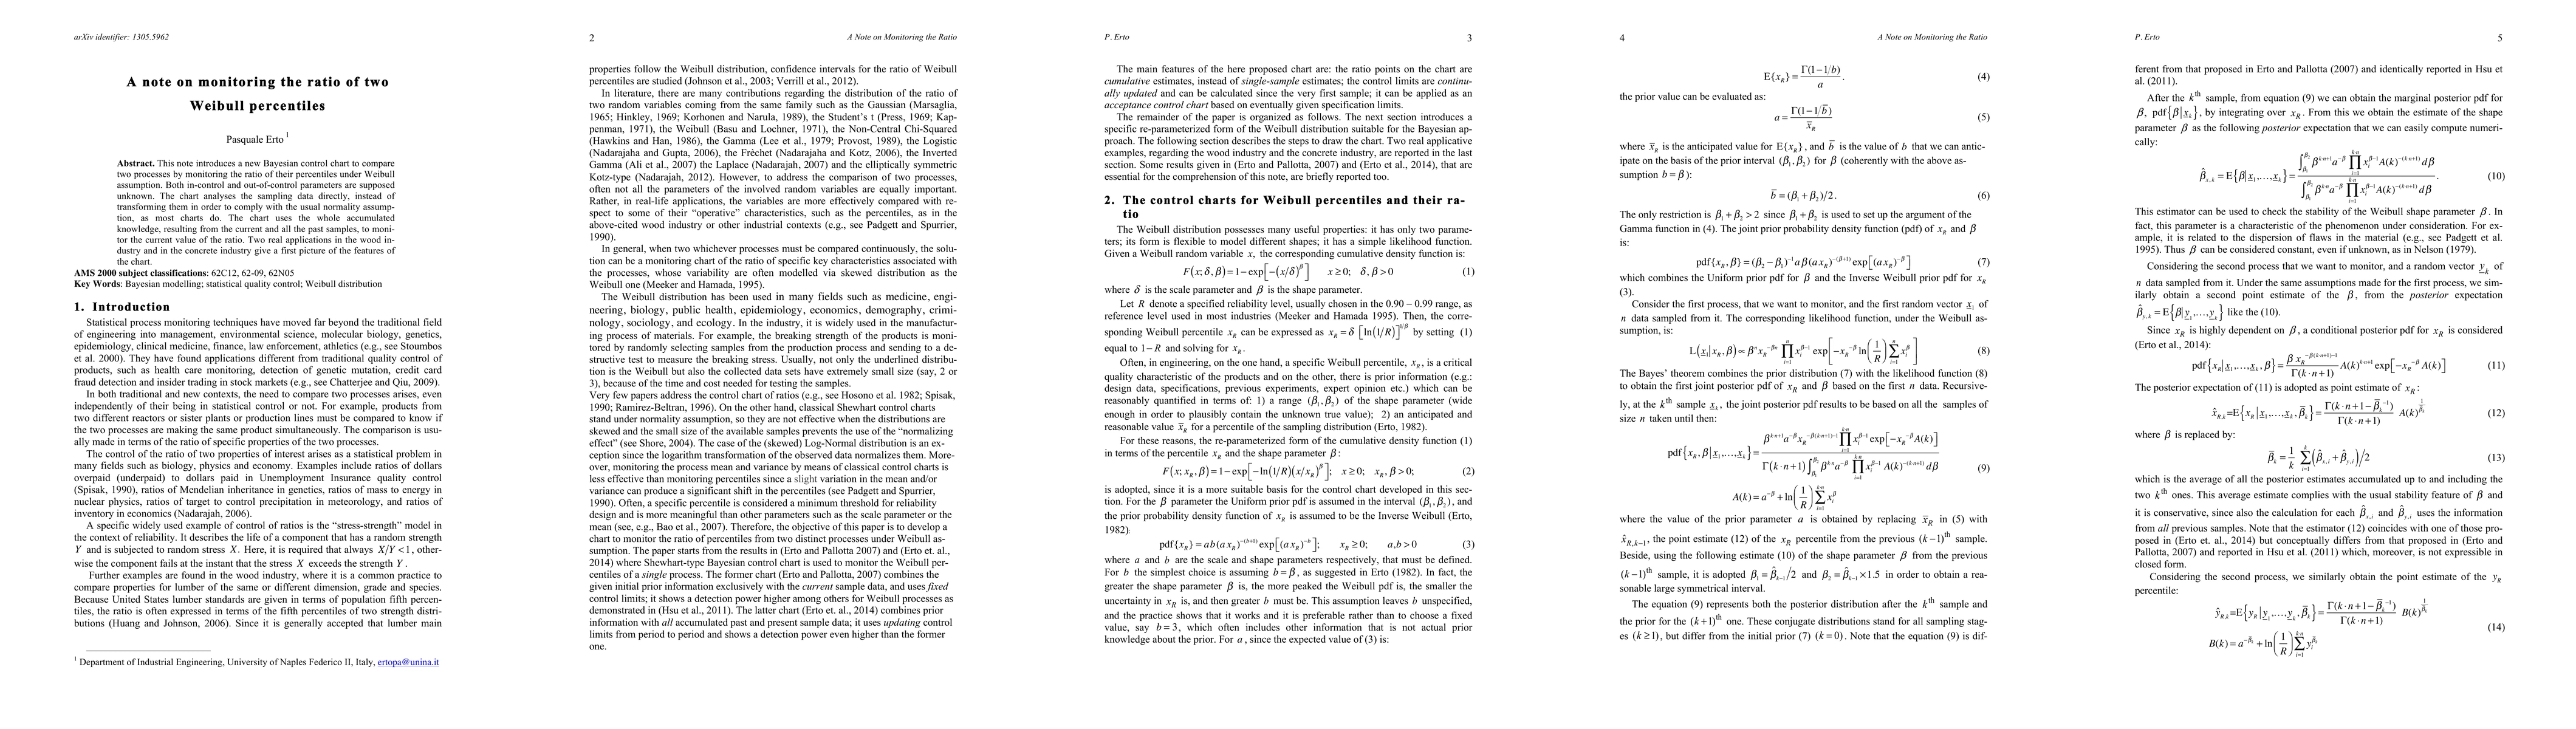
This note introduces a new Bayesian control chart to compare two processes by monitoring the ratio of their percentiles under Weibull assumption. Both in-control and out-of-control parameters are supposed unknown. The chart analyses the sampling data directly, instead of transforming them in order to comply with the usual normality assumption, as most charts do. The chart uses the whole accumulated knowledge, resulting from the current and all the past samples, to monitor the current value of the ratio. Two real applications in the wood industry and in the concrete industry give a first picture of the features of the chart.
AI Key Findings
Get AI-generated insights about this paper's methodology, results, and significance.
Paper Details
PDF Preview
Key Terms
Citation Network
Current paper (gray), citations (green), references (blue)
Display is limited for performance on very large graphs.
Similar Papers
Found 4 papers| Title | Authors | Year | Actions |
|---|
Comments (0)