Summary
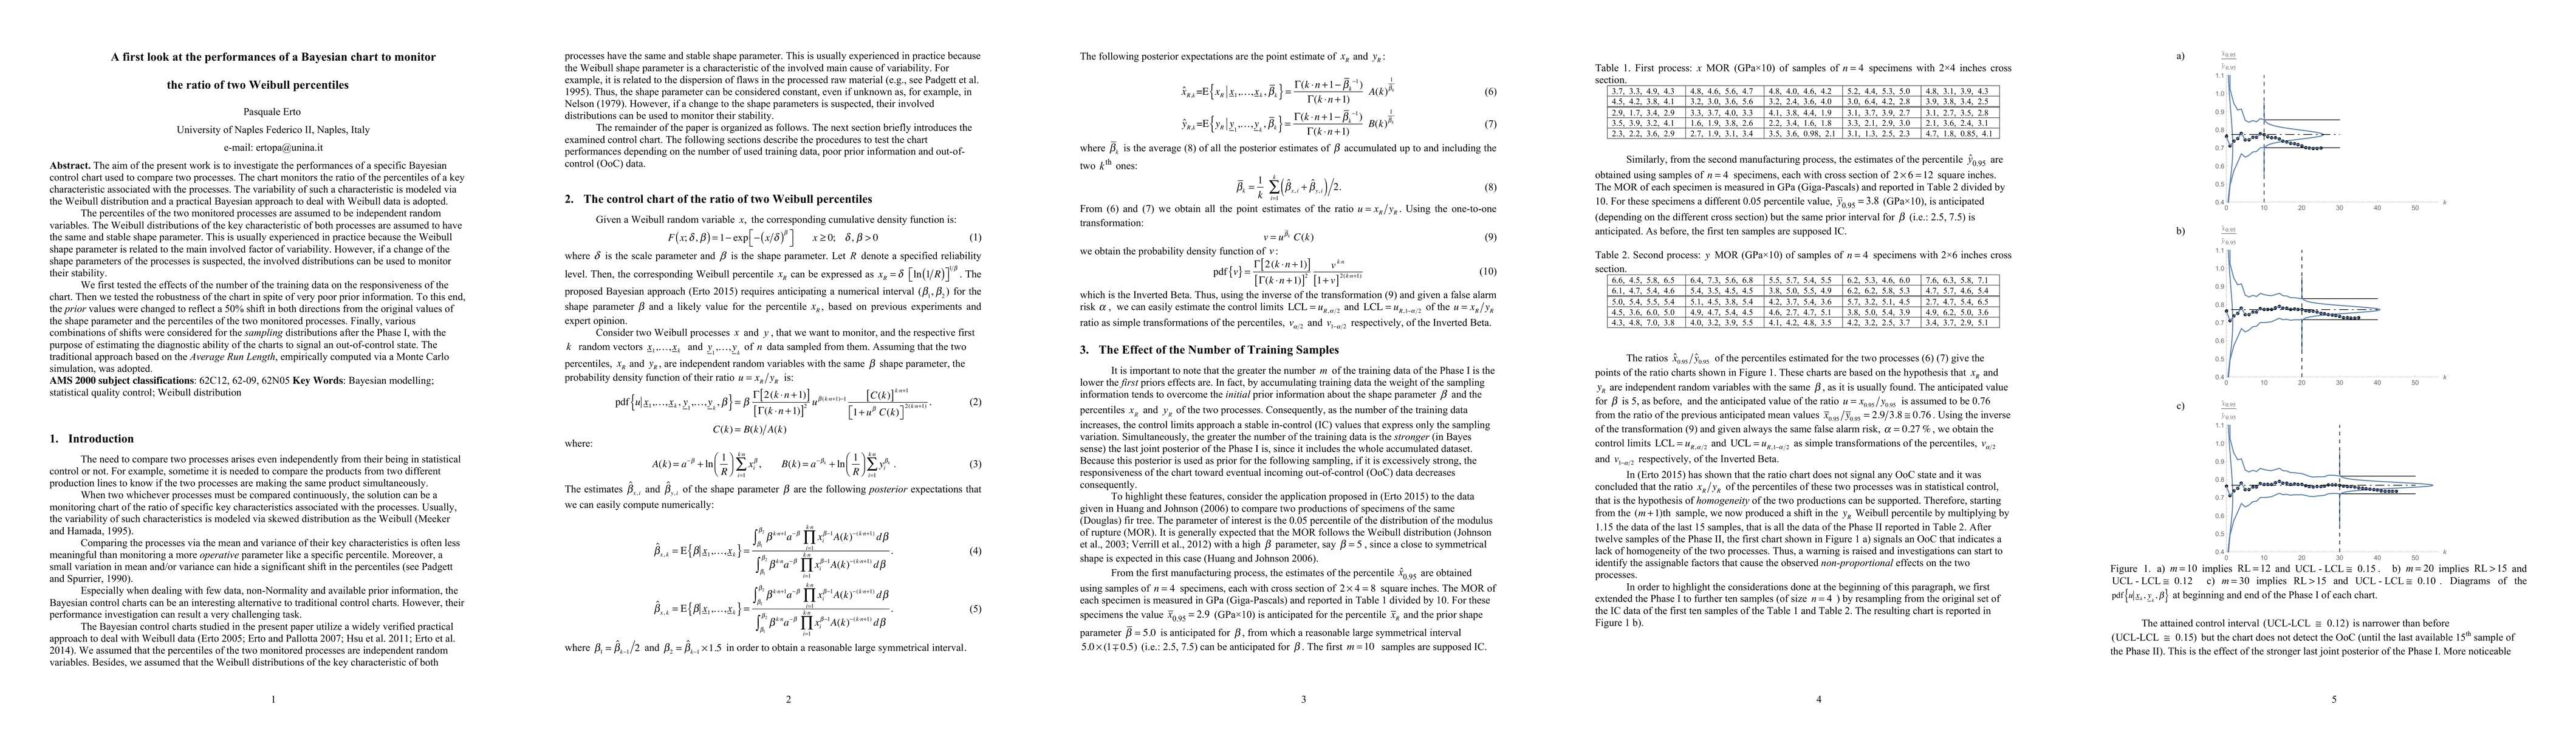
The aim of the present work is to investigate the performances of a specific Bayesian control chart used to compare two processes. The chart monitors the ratio of the percentiles of a key characteristic associated with the processes. The variability of such a characteristic is modeled via the Weibull distribution and a practical Bayesian approach to deal with Weibull data is adopted. The percentiles of the two monitored processes are assumed to be independent random variables. The Weibull distributions of the key characteristic of both processes are assumed to have the same and stable shape parameter. This is usually experienced in practice because the Weibull shape parameter is related to the main involved factor of variability. However, if a change of the shape parameters of the processes is suspected, the involved distributions can be used to monitor their stability. We first tested the effects of the number of the training data on the responsiveness of the chart. Then we tested the robustness of the chart in spite of very poor prior information. To this end, the prior values were changed to reflect a 50% shift in both directions from the original values of the shape parameter and the percentiles of the two monitored processes. Finally, various combinations of shifts were considered for the sampling distributions after the Phase I, with the purpose of estimating the diagnostic ability of the charts to signal an out-of-control state. The traditional approach based on the Average Run Length, empirically computed via a Monte Carlo simulation, was adopted.
AI Key Findings
Get AI-generated insights about this paper's methodology, results, and significance.
Paper Details
PDF Preview
Key Terms
Citation Network
Current paper (gray), citations (green), references (blue)
Display is limited for performance on very large graphs.
Similar Papers
Found 4 papersNo citations found for this paper.
Comments (0)