Publication
Metrics
AI Quick Summary
This paper proposes a method to estimate excess mortality rates in chronic condition patients using current status data and disease duration, requiring age, time at survey, chronic condition presence, and duration. A simulation study shows the method's feasibility but requires a large sample size (100,000+) for accurate estimation.
Paper Preview
Abstract
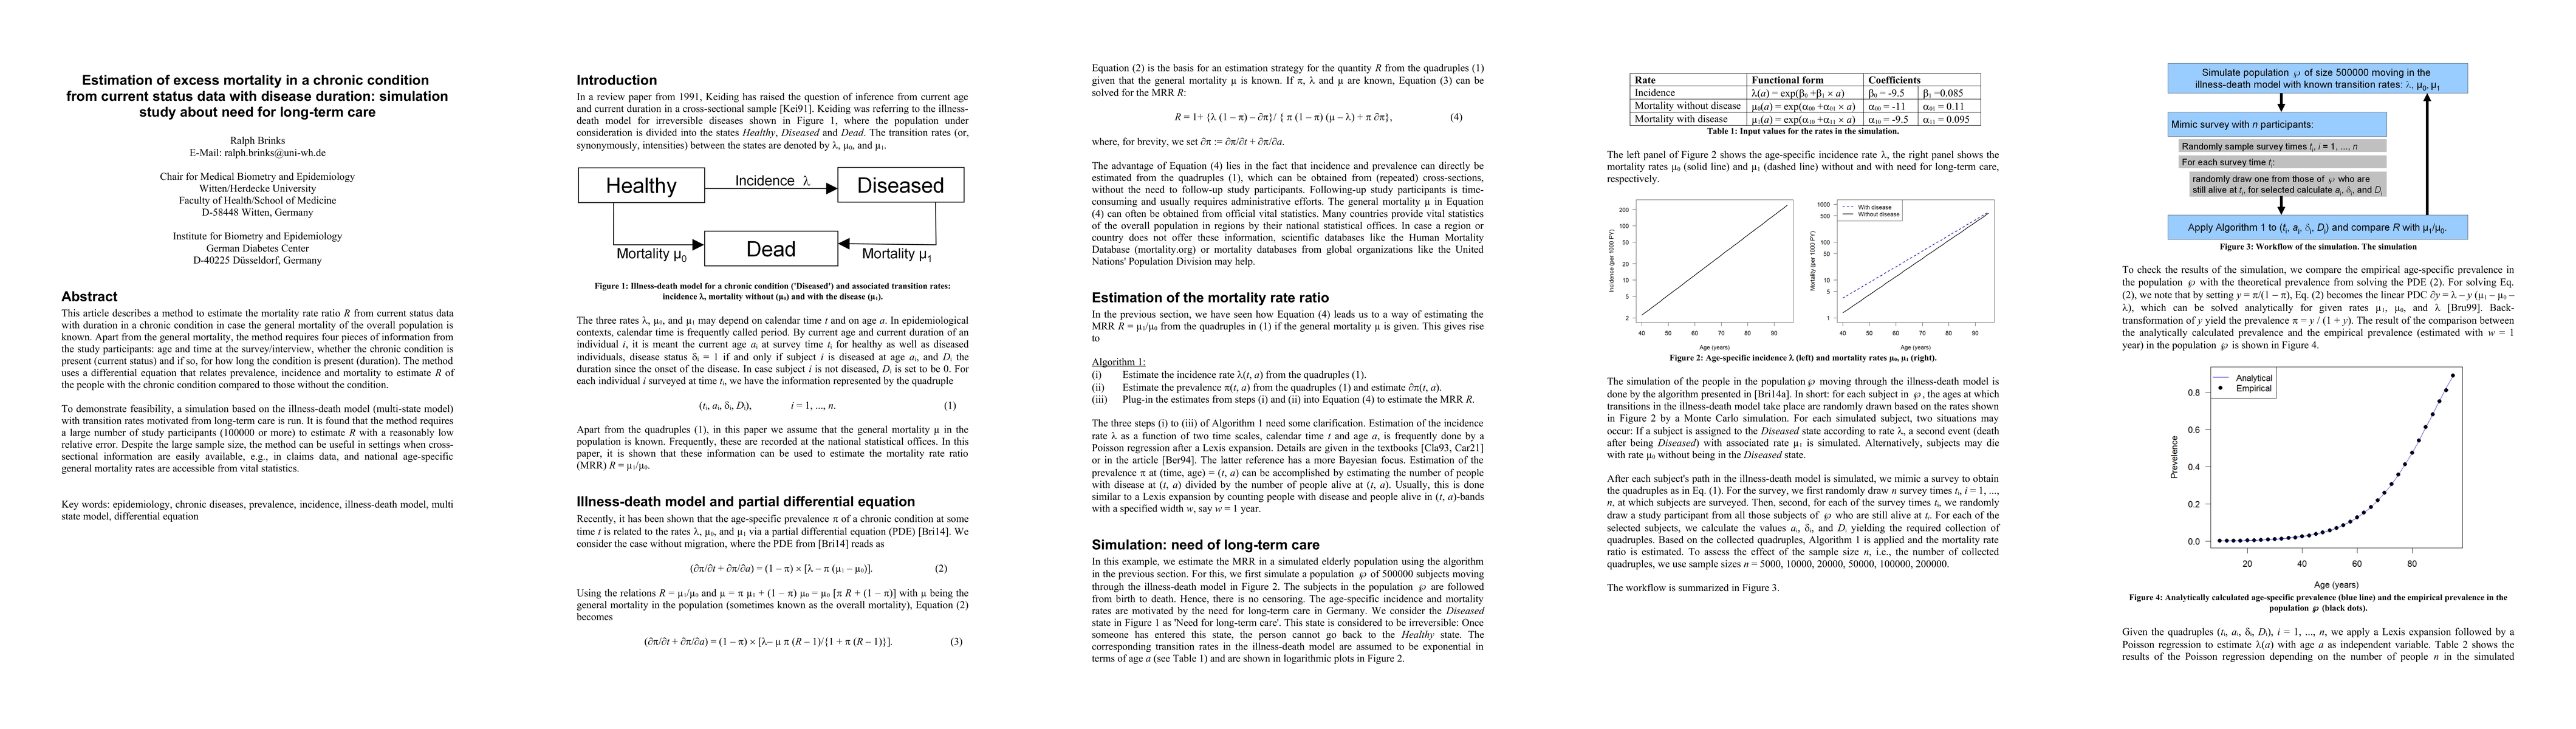
This article describes a method to estimate the mortality rate ratio R from current status data with duration in a chronic condition in case the general mortality of the overall population is known. Apart from the general mortality, the method requires four pieces of information from the study participants: age and time at the survey/interview, whether the chronic condition is present (current status) and if so, for how long the condition is present (duration). The method uses a differential equation that relates prevalence, incidence and mortality to estimate R of the people with the chronic condition compared to those without the condition. To demonstrate feasibility, a simulation based on the illness-death model (multi-state model) with transition rates motivated from long-term care is run. It is found that the method requires a large number of study participants (100000 or more) to estimate R with a reasonably low relative error. Despite the large sample size, the method can be useful in settings when cross-sectional information are easily available, e.g., in claims data, and national age-specific general mortality rates are accessible from vital statistics.
AI Key Findings
Get AI-generated insights about this paper's methodology, results, significance, and more — seven facets brought into focus.
Impact
Paper Details
Authors
PDF Preview
Key Terms
Citation Network
Current paper (gray), citations (green), references (blue)
Display is limited for performance on very large graphs.
Discussion 0