Authors
Summary
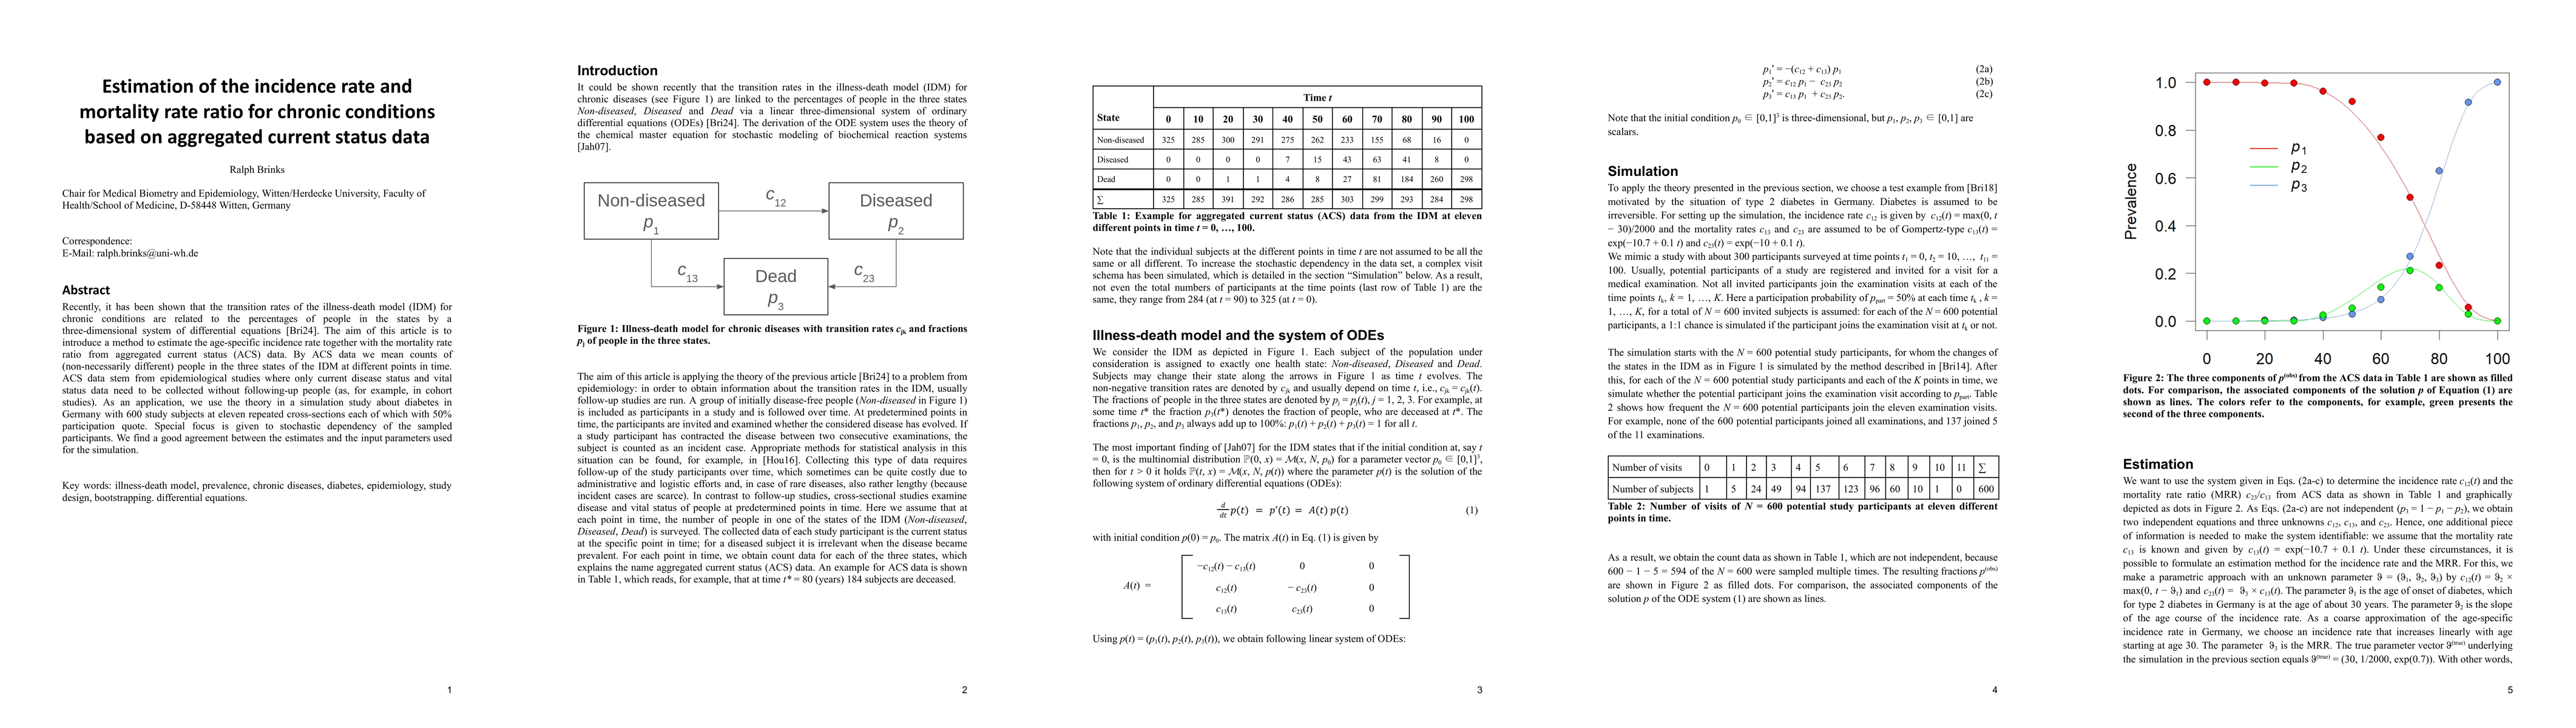
Recently, it has been shown that the transition rates of the illness-death model (IDM) for chronic conditions are related to the percentages of people in the states by a three-dimensional system of differential equations [Bri24]. The aim of this article is to introduce a method to estimate the age-specific incidence rate together with the mortality rate ratio from aggregated current status (ACS) data. By ACS data we mean counts of (non-necessarily different) people in the three states of the IDM at different points in time. ACS data stem from epidemiological studies where only current disease status and vital status data need to be collected without following-up people (as, for example, in cohort studies). As an application, we use the theory in a simulation study about diabetes in Germany with 600 study subjects at eleven repeated cross-sections each of which with 50% participation quote. Special focus is given to stochastic dependency of the sampled participants. We find a good agreement between the estimates and the input parameters used for the simulation.
AI Key Findings
Generated Jun 12, 2025
Methodology
The paper introduces a method to estimate age-specific incidence rate and mortality rate ratio (MRR) from aggregated current status (ACS) data using a three-dimensional system of differential equations based on the illness-death model (IDM).
Key Results
- The method was applied in a simulation study on diabetes in Germany with 600 study subjects, demonstrating good agreement between estimates and input parameters.
- Two estimation techniques were developed: least squares minimization and maximum likelihood optimization.
- A bootstrapping approach was suggested for inference in cases where samples are not stochastically independent.
Significance
This research is significant as it allows for the estimation of crucial epidemiological parameters using ACS data, which does not require individual follow-up, thus simplifying data collection and respecting data protection, especially for sensitive diseases.
Technical Contribution
The paper presents a novel approach to estimate incidence rate and MRR from ACS data using a system of differential equations, along with two estimation methods and a bootstrapping technique for inference.
Novelty
The work is novel in its application of differential equation systems to ACS data for estimating key epidemiological parameters without the need for individual follow-up, addressing data protection concerns and simplifying study design.
Limitations
- The method assumes knowledge of the true mortality rate c13.
- The bootstrapping approach may be computationally intensive for large datasets.
Future Work
- Exploration of alternative estimation techniques for when mortality rate c13 is unknown.
- Investigating computational efficiency improvements for the bootstrapping method.
Paper Details
PDF Preview
Similar Papers
Found 4 papersMaximum likelihood estimation for aggregate current status data: Simulation study using the illness-death model for chronic diseases with duration dependency
Ralph Brinks, Maryam Saem
No citations found for this paper.
Comments (0)