Background
Influence diagrams (IDs) were introduced to compactly represent decision problems under uncertainty. They combine chance nodes (random variables), decision nodes (choices), and value nodes (utilities). Traditional methods either eliminate nodes directly on the ID or transform the problem into inference tasks on Bayesian networks or junction trees. A key insight, emphasized by Shachter, Nielsen, Jensen, and others, is that not all information in an ID is requisite for computing optimal policies; some variables known at one decision may not be necessary for later decisions. The LIMID framework formalizes this idea by separating the representation of requisite information from the rest of the diagram, yielding a simpler structure that still supports exact solution methods. The LIMID formalism was developed by Lauritzen and Nilsson (1999) and then applied to decision problems by Nilsson and Lauritzen.
Problem / Research Question
The central challenge is computational: evaluating IDs can be memory- and time-intensive due to unnecessary information being carried through to every decision. The research asks whether we can systematically strip away non-requisite information, obtain a soluble, minimal representation (a LIMID), and still compute exact optimal policies efficiently. In particular, can an exact, recursive procedure be devised that leverages a reduced structure and a junction-tree-based inference scheme to outperform traditional ID-evaluation methods while guaranteeing optimality?
Innovation / Contribution
The paper makes several key contributions:
- It introduces and formalizes Limited Memory Influence Diagrams (LIMIDs) as a reduced, explicit representation of decision problems, separating requisite from non-requisite information.
- It defines solubility for LIMIDs and proves that the LIMID version of any ID is soluble, enabling a bottom-up policy computation strategy.
- It presents the SINGLE POLICY UPDATING algorithm, a simple, exact procedure that computes an optimal strategy by solving one decision node at a time in an exact solution ordering, converting decided nodes into chance nodes as the computation proceeds.
- It shows how to reduce soluble LIMIDs to a minimal LIMID by deleting non-requisite parents, without changing the maximum expected utility, and proves that optimal strategies are preserved under reduction.
- It describes a practical pipeline to construct a junction tree from a LIMID and perform efficient message passing with LIMID potentials, so that optimal policies can be extracted without storing large intermediate tables.
- It introduces a refinement (Theorem 5) that identifies when some messages are unnecessary, further reducing computational load in practice.
Methodology / Approach
The workflow begins by transforming an ID into its LIMID version, clarifying that forgotten variables need not be carried forward to later decisions. Decision nodes are then assessed for extremality: a node is extremal if all utility influence paths from it to relevant utilities are captured via its descendants. Theorem 1 ensures that an extremal node has an optimal policy, and under the uniform strategy, this policy is optimal for that node. Once a node’s policy is obtained, the node is converted into a chance node with that policy, and the process proceeds in a prescribed exact solution ordering.
Next, the LIMID is reduced to its minimal form by iteratively removing non-requisite parents of decision nodes in reverse order (dk down to d1). Reduction preserves the maximum expected utility and solubility (Theorem 3). The reduced LIMID is then compiled into a junction tree via moralization and triangulation; three phases—initialization of clique potentials, message passing, and collection of evidence—mirror standard junction-tree inference but operate on LIMID potentials (probability and utility parts).
To compute optimum policies, the approach uses local contractions of clique potentials to isolate the effect of a decision’s conditioning set pa(d) and then selects the argmax to define the local policy Jd. The overall strategy is assembled by repeatedly fixing policies for extremal decisions, updating the junction tree potentials, and continuing until policies for all decisions are determined. A partial propagation variant (Theorem 5) further reduces message traffic by exploiting independence structure, showing that some messages can be omitted without affecting the final optimal policies.
Experiments / Evaluation
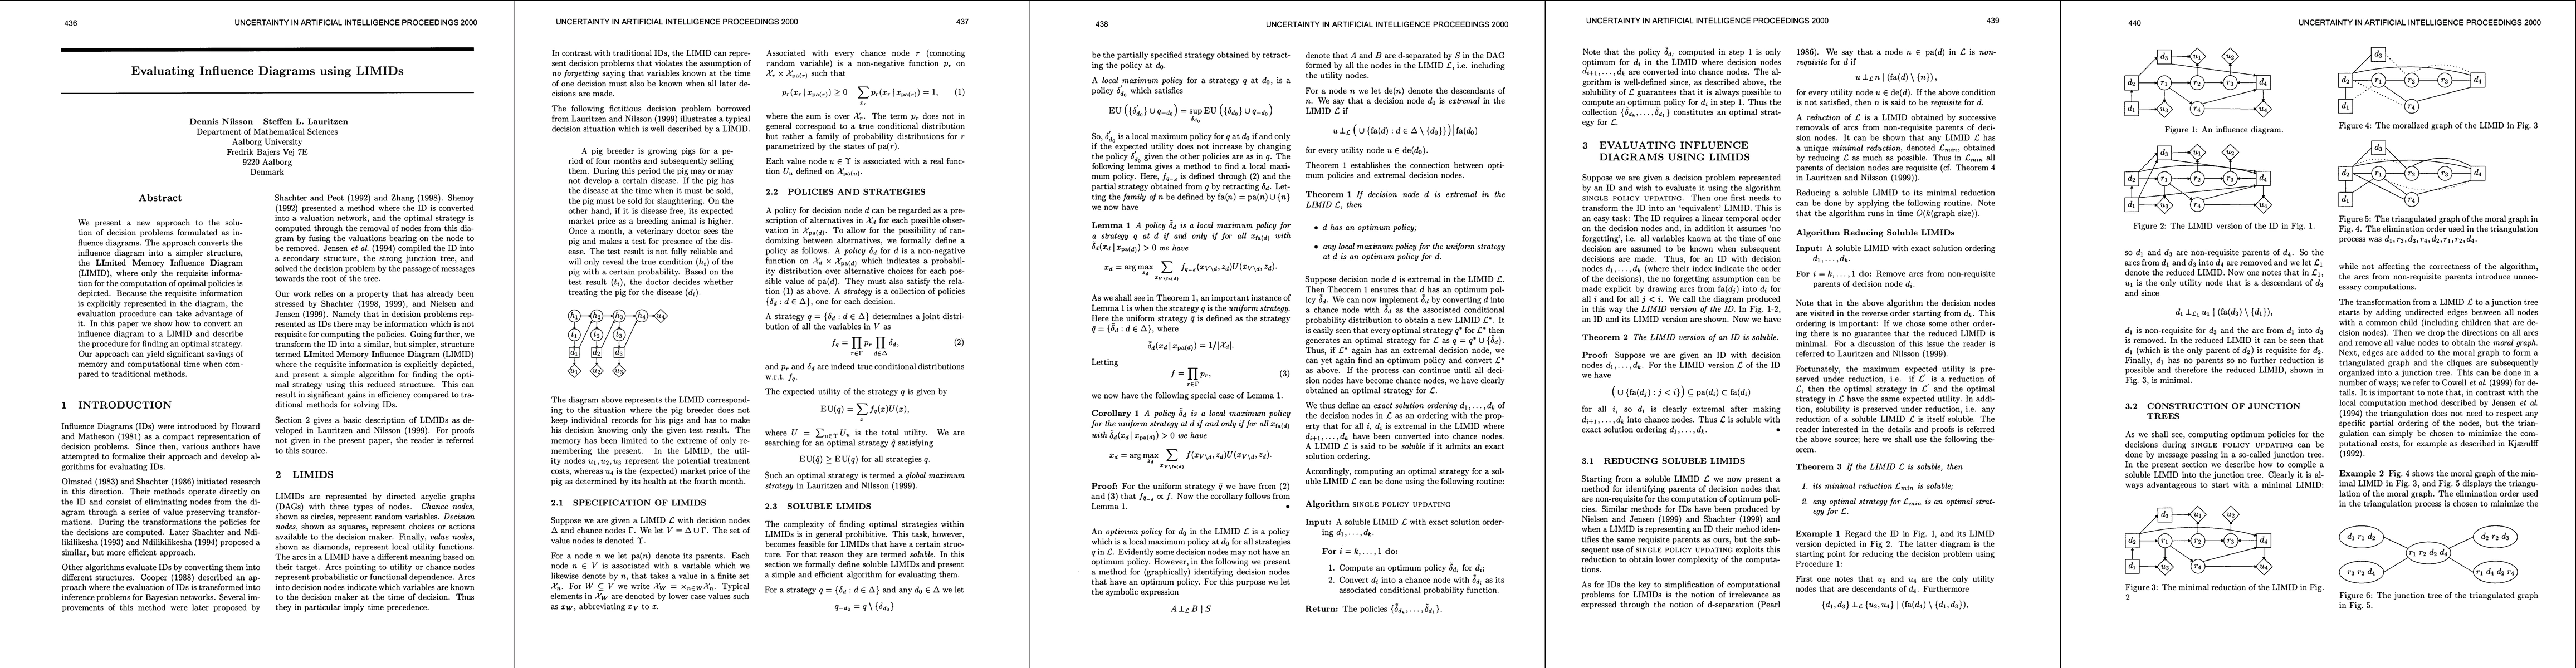
The authors illustrate the method with several worked examples drawn from the ID/LIMID literature. Example 1 shows the reduction of an ID to a minimal LIMID and the resulting smaller, more efficient structure. Example 2 contrasts the junction tree sizes between the LIMID-based construction and the strong junction tree approach, showing that the LIMID-based tree can have smaller maximal cliques, which reduces the cost of message passing. Example 3 demonstrates the standard propagation dynamics in the junction tree and how optimal policies are computed progressively. Example 4 applies Theorem 5 to demonstrate substantial reductions in the number of flows (messages) needed during evaluation, highlighting practical gains in communication overhead.
Overall, the evaluation in the paper is qualitative and illustrative rather than presenting exhaustive benchmarks. The results consistently indicate that the LIMID approach can yield smaller junction trees and fewer expensive computations when non-requisite information is pruned, potentially delivering memory and time savings relative to traditional ID-to-JT methods. The theorems provide formal guarantees about optimality preservation and correctness of the message passing scheme.
Key Results
The paper establishes a sequence of formal guarantees that underpin the practical method:
- Theorem 1 links extremality of a decision node in a LIMID to the existence and computation of an optimum policy for that node, with local maxima under the uniform strategy sufficing as optimum policies.
- Theorem 2 states that the LIMID version of any ID is soluble, ensuring a well-defined exact solution ordering for evaluation.
- Theorem 3 shows that reducing a soluble LIMID to its minimal form preserves solubility and that any optimal strategy in the minimal LIMID is also optimal in the original LIMID.
- Theorem 4 ensures that message passing on the junction tree yields correct marginals for the purposes of evaluating the LIMID potential and extracting optimal policies.
- Theorem 5 provides a practical redundancy criterion: under certain conditioning, some neighbor messages to a root clique are unnecessary, enabling skip of communication without loss of optimality.
These results collectively justify the algorithmic pipeline: transform to LIMID, perform minimal reduction, construct a junction tree, and use targeted message passing to extract the optimal strategy. The examples demonstrate concrete reductions in complexity and illustrate the potential efficiency gains in realistic scenarios.
Practical Applications
The LIMID framework targets a broad class of sequential decision problems under uncertainty encountered in engineering, economics, health, agriculture, and AI planning. By focusing computation on requisite information, researchers and practitioners can tackle larger or more complex decision problems than feasible with standard ID evaluation methods. The combination of reduction to minimal LIMIDs and efficient junction-tree inference enables exact solutions with potentially smaller clique structures and fewer memory-intensive intermediates, making LIMIDs attractive for decision support systems, risk analysis, and computational decision theory. Additionally, the framework provides a groundwork for scalable approximations by solving soluble LIMIDs that approximate larger, intractable IDs.
Limitations & Considerations
Despite the benefits, the LIMID approach has limitations. In practice, the performance gains depend on the structure of the problem: some problem instances may still yield large maximal cliques in the junction tree, or require many messages, offsetting some of the theoretical advantages. The exact solution ordering, crucial for solubility and efficiency, may be nontrivial to determine in large problems and can influence the size of the reduced LIMID. While Theorems 2 and 3 guarantee preservation of optimality under reduction, the overhead of the initial LIMID transformation, reduction, and junction-tree construction can be non-negligible. The paper focuses on discrete variables and finite state spaces; extending to continuous or hybrid domains would require additional adaptation. Finally, empirical benchmarks on diverse real-world datasets would help characterize scalability and guide practitioners in choosing when LIMIDs offer practical advantages over existing ID-based methods.
Discussion 0