Background
Influence diagrams provide a compact representation for decision problems under uncertainty, but traditional approaches rely on discrete probability mass functions for all uncertain variables. When continuous uncertainties are present, discretization or restrictive Gaussian-based models (which enforce conditionally linear Gaussian behavior) are common but limiting. Prior work explored mixtures of Gaussians and similar hybrids, yet they either constrained discrete nodes or required particular structural forms for the utility. This paper builds on Moral, Rumí, and Salmerón's work on mixtures of truncated exponentials (MTE) and extends it to influence diagrams, proposing that both probability densities and the joint utility function can be represented as MTE potentials, with all decision nodes kept discrete. The solution method relies on Shenoy’s fusion algorithm (variable elimination) adapted to operate purely with MTE combination and marginalization. This places the MTE framework as a unifying, exact solver for a broad class of hybrid decision problems.
Problem / Research Question
The central challenge is to represent and solve influence diagrams that include a mix of discrete and continuous chance variables and nonstandard utility structures, without the biases or restrictions introduced by discretization and without forcing continuous distributions into Gaussian-like forms. The paper asks whether MTE potentials can serve as a universal representation for both probability and utility, and whether the fusion algorithm can operate within this representation while preserving tractability and exactness when decision nodes are discrete.
Innovation / Contribution
The paper's core contribution is formalizing MTE influence diagrams, where all probability densities are MTEs and the joint utility (or its multiplicative factors) is an MTE potential. It introduces two practical forms of MTE potentials: a piecewise parametric structure that can handle continuous domains, including partitions of hypercubes for continuous variables and arbitrary partitions for discrete/decision variables, and a normalization framework to ensure valid probability densities. It shows that MTE potentials are closed under multiplication (combination) and marginalization, enabling the use of the fusion algorithm for exact solutions. Theorem 1 guarantees that marginalization of discrete decision variables preserves an MTE form, which is crucial for the solution procedure. The approach also provides a systematic method to approximate common PDFs (normal, lognormal, gamma, etc.) with MTE fragments and to approximate joint utilities via additive or multiplicative MTE decompositions.
Methodology / Approach
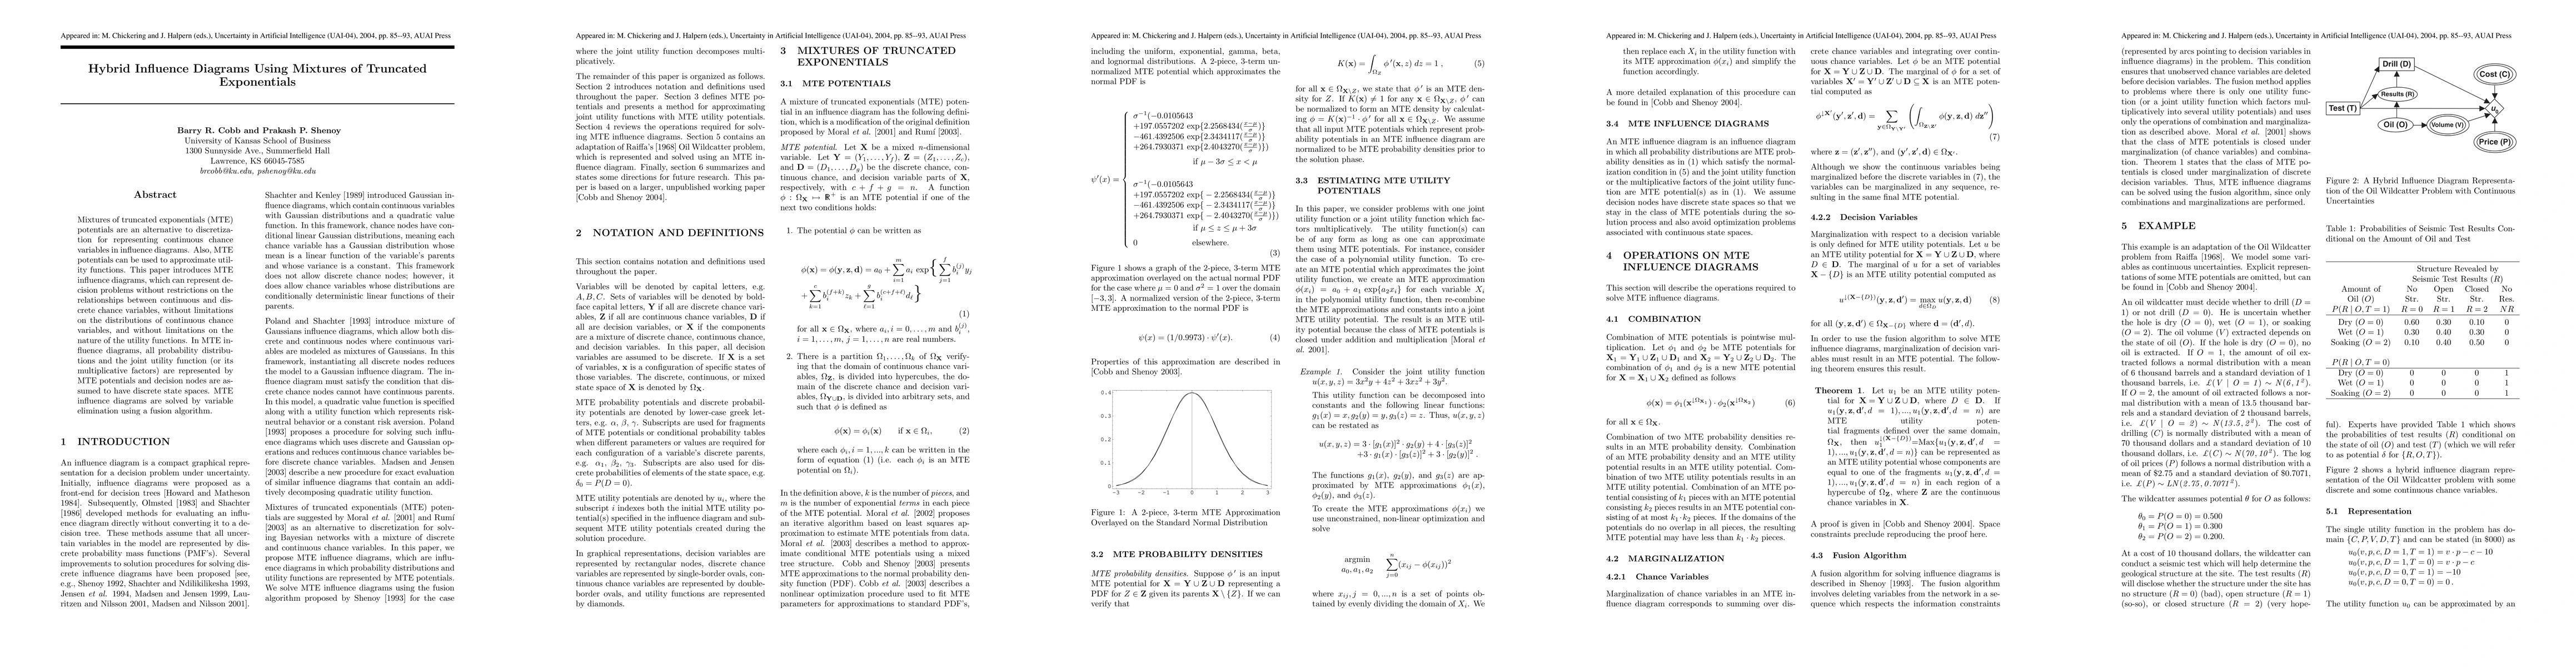
Key steps include: (1) encoding the problem with X partitioned into discrete chance Y, continuous chance Z, and discrete decisions D, with all probability densities represented as MTEs and the joint utility as an MTE utility potential. (2) Constructing MTE approximations for PDFs of continuous variables (e.g., normal via a 2-piece, 3-term MTE; lognormal via established MTE approximations). (3) Approximating the joint utility function using MTE fragments per variable and reassembling them into a joint MTE utility potential when possible. (4) Solving via fusion: repeatedly combine (multiply) potentials and marginalize variables in a sequence that respects information constraints, ultimately marginalizing decision variables to produce an optimal policy under a multiplicative-utility assumption. (5) Demonstrating the workflow on the Oil Wildcatter problem, where continuous quantities such as V (oil volume), C (cost), and P (price) are modeled as MTEs, while discrete decisions (drill D and test T) remain discrete.
Experiments / Evaluation
The paper presents an explicit, worked example adapting Raiffa’s Oil Wildcatter to an MTE influence diagram. It models V|O with a normal PDF approximated by a 2-piece MTE, C with a normal MTE, and P with a lognormal MTE approximation. The single utility function (or its multiplicative factors) is approximated with MTEs, and the fusion sequence is executed: remove C via u2 = (u1 ⊗ ϑ) ↓{P,V,D,T}, remove P via u3 = (u2 ⊗ ρ) ↓{V,D,T}, remove V via u4 = (u3 ⊗ ν) ↓{O,D,T}, then remove O using θ and δ, and finally marginalize the decision D. The results yield a specific optimal policy and an expected profit: in one variant, the maximum expected profit is $22,550 with the test decision T = 1; in the continuous-test variant, the maximum expected profit is $19,802. These numbers illustrate how the MTE approach yields actionable strategic guidance while handling continuous uncertainties and nonstandard distributions within a single framework.
Key Results
The core technical results include: (a) MTE potentials form a closed class under multiplication and marginalization, enabling exact solutions with the fusion algorithm; (b) Theorem 1 ensures that marginalization of discrete decision variables yields an MTE potential, preserving tractability; (c) The Oil Wildcatter example demonstrates the practical workflow, showing how continuous uncertainties and a nonlinear (even piecewise) utility can be represented and solved without discretization, with explicit policy recommendations and quantified expected profits. (d) The approach accommodates a wide variety of continuous distributions (Gaussian, gamma, beta, lognormal, etc.) through MTE approximations, broadening the modeling space beyond Gaussian-only frameworks.
Practical Applications
This framework is well suited for decision problems that feature mixed discrete and continuous uncertainties coupled with complex or nonlinear utilities. Potential domains include energy exploration and natural resource management, finance and risk assessment, engineering design under uncertainty, and any scenario where discretization would degrade fidelity or where standard Gaussian assumptions are invalid. The ability to model PDFs and utilities with a single mathematical object simplifies model construction and provides a principled path to exact solutions via fusion.
Limitations & Considerations
The authors acknowledge several caveats: numerical stability can be an issue when MTE parameters are extreme; the method relies on multiplicative (not additive) factorizations of the joint utility, because division is not closed within MTEs; decision nodes must be discrete, as Theorem 1’s guarantees rely on discrete D; continuous decision variables and the associated optimization remain an open and challenging area; complexity grows with the number of pieces and the domain partitioning, which can lead to scalability concerns for large networks; and the accuracy hinges on the quality of MTE approximations for PDFs and utilities, necessitating careful validation.
A concise synthesis
MTE influence diagrams offer a principled, exact approach to hybrid decision problems by representing all probabilities and utilities as MTE potentials and solving via fusion. This unifies modeling of diverse continuous distributions with arbitrary, multiplicative utilities and preserves tractability under discrete decisions. The Oil Wildcatter example demonstrates concrete workflow and payoff gains, illustrating the method’s promise for real-world hybrid uncertainty problems while highlighting avenues for further refinement and scalability.
Discussion 0