Publication
Metrics
AI Quick Summary
This paper introduces a triptych of diagnostic graphics—reliability diagram, ROC curve, and Murphy diagram—to evaluate probabilistic classifiers. These tools assess calibration, discrimination, and overall predictive performance, respectively, and are demonstrated through empirical examples in various fields.
Paper Preview
Abstract
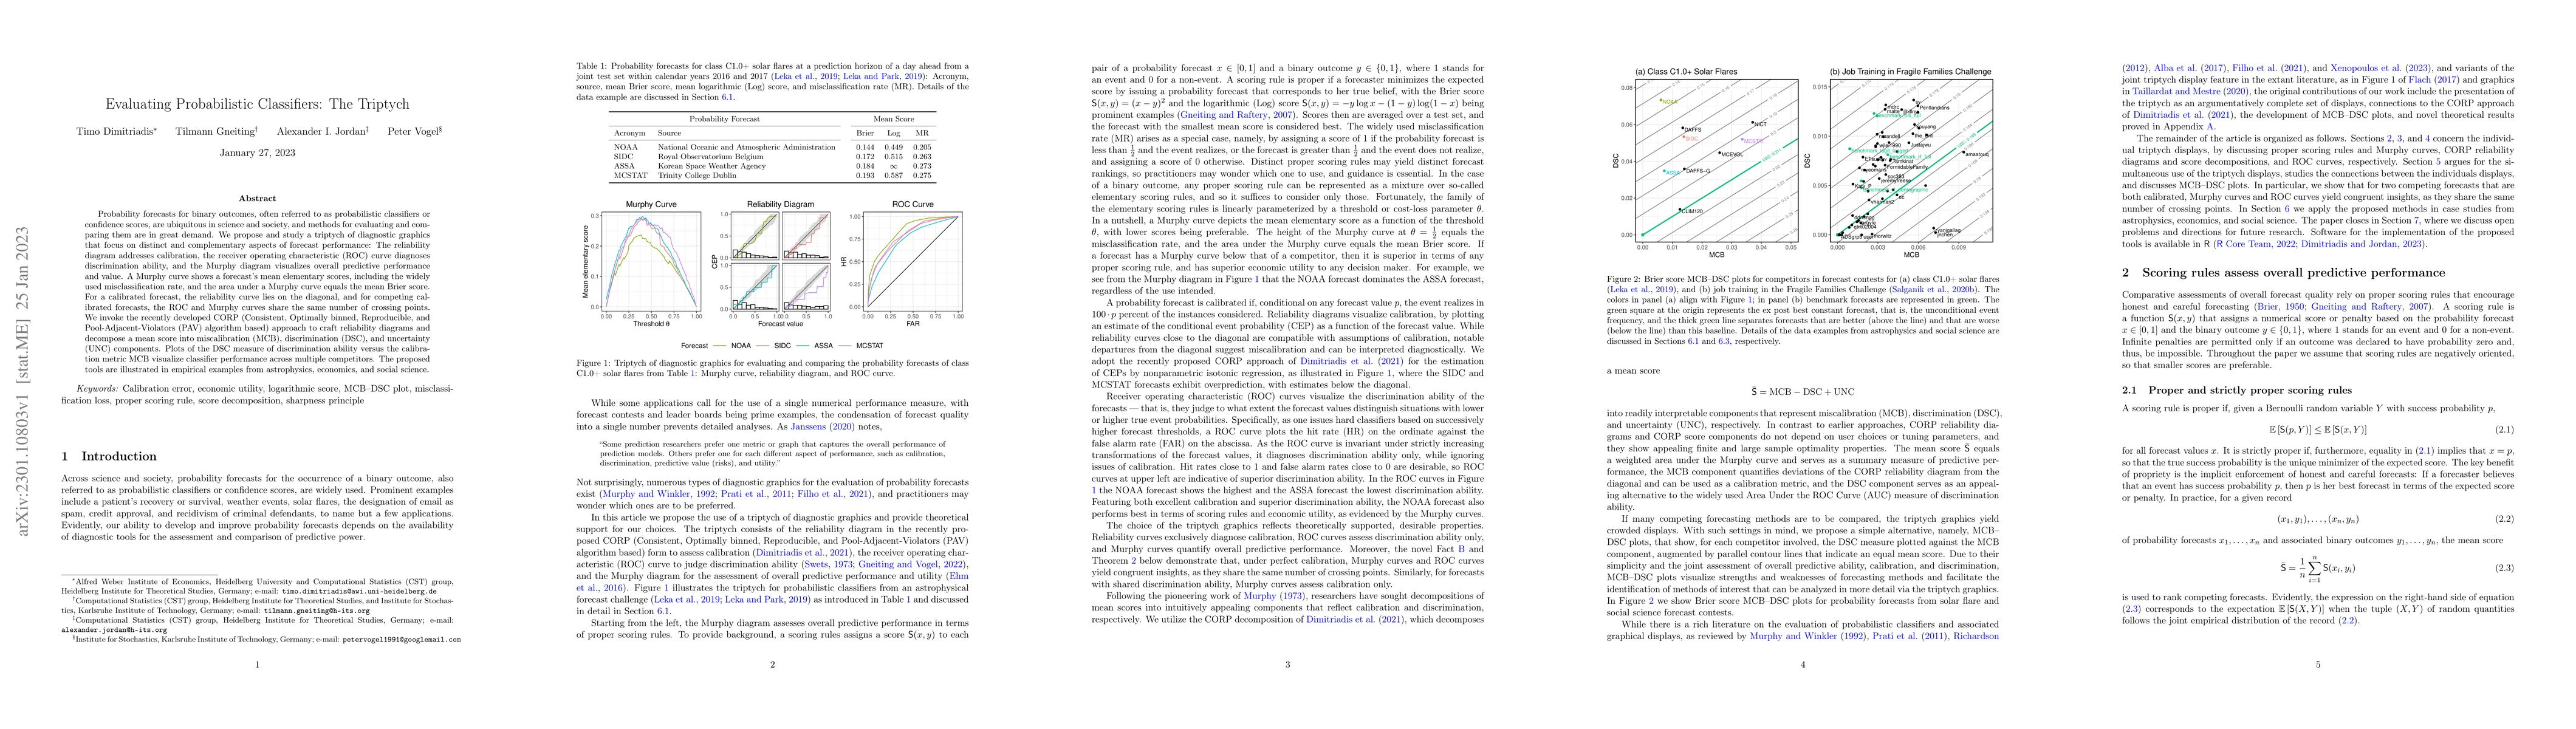
Probability forecasts for binary outcomes, often referred to as probabilistic classifiers or confidence scores, are ubiquitous in science and society, and methods for evaluating and comparing them are in great demand. We propose and study a triptych of diagnostic graphics that focus on distinct and complementary aspects of forecast performance: The reliability diagram addresses calibration, the receiver operating characteristic (ROC) curve diagnoses discrimination ability, and the Murphy diagram visualizes overall predictive performance and value. A Murphy curve shows a forecast's mean elementary scores, including the widely used misclassification rate, and the area under a Murphy curve equals the mean Brier score. For a calibrated forecast, the reliability curve lies on the diagonal, and for competing calibrated forecasts, the ROC and Murphy curves share the same number of crossing points. We invoke the recently developed CORP (Consistent, Optimally binned, Reproducible, and Pool-Adjacent-Violators (PAV) algorithm based) approach to craft reliability diagrams and decompose a mean score into miscalibration (MCB), discrimination (DSC), and uncertainty (UNC) components. Plots of the DSC measure of discrimination ability versus the calibration metric MCB visualize classifier performance across multiple competitors. The proposed tools are illustrated in empirical examples from astrophysics, economics, and social science.
AI Key Findings
Get AI-generated insights about this paper's methodology, results, significance, and more — seven facets brought into focus.
Impact
Paper Details
Authors
PDF Preview
Key Terms
Citation Network
Current paper (gray), citations (green), references (blue)
Display is limited for performance on very large graphs.
Discussion 0