Evaluation of two interaction techniques for visualization of dynamic graphs
Publication
Metrics
AI Quick Summary
This study evaluates two interaction techniques for dynamic graph visualization: layout stability adjustment and adjacent node/edge highlighting. Results show that both techniques improve accuracy, with highlighting being more effective for most tasks except the most complex ones, though at the expense of longer task completion times.
Paper Preview
Abstract
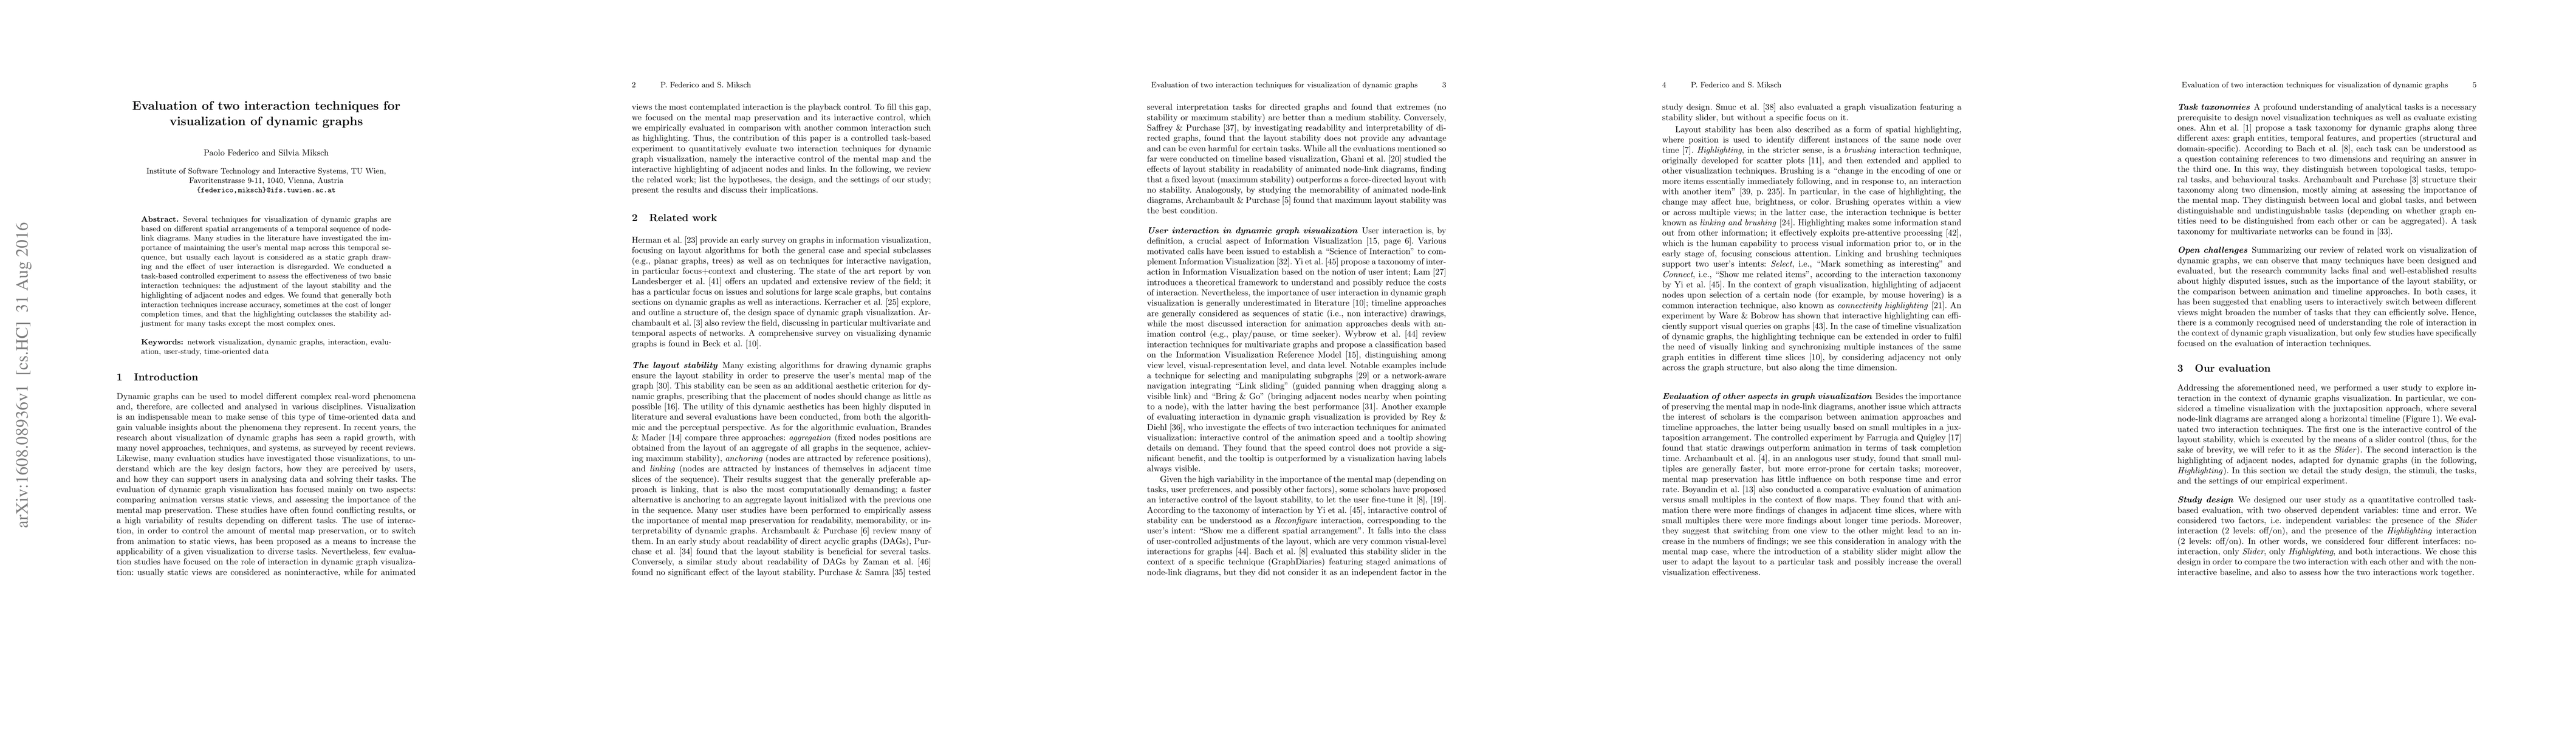
Several techniques for visualization of dynamic graphs are based on different spatial arrangements of a temporal sequence of node-link diagrams. Many studies in the literature have investigated the importance of maintaining the user's mental map across this temporal sequence, but usually each layout is considered as a static graph drawing and the effect of user interaction is disregarded. We conducted a task-based controlled experiment to assess the effectiveness of two basic interaction techniques: the adjustment of the layout stability and the highlighting of adjacent nodes and edges. We found that generally both interaction techniques increase accuracy, sometimes at the cost of longer completion times, and that the highlighting outclasses the stability adjustment for many tasks except the most complex ones.
AI Key Findings
Get AI-generated insights about this paper's methodology, results, significance, and more — seven facets brought into focus.
Impact
Paper Details
PDF Preview
Key Terms
Citation Network
Current paper (gray), citations (green), references (blue)
Display is limited for performance on very large graphs.
Discussion 0