Authors
Summary
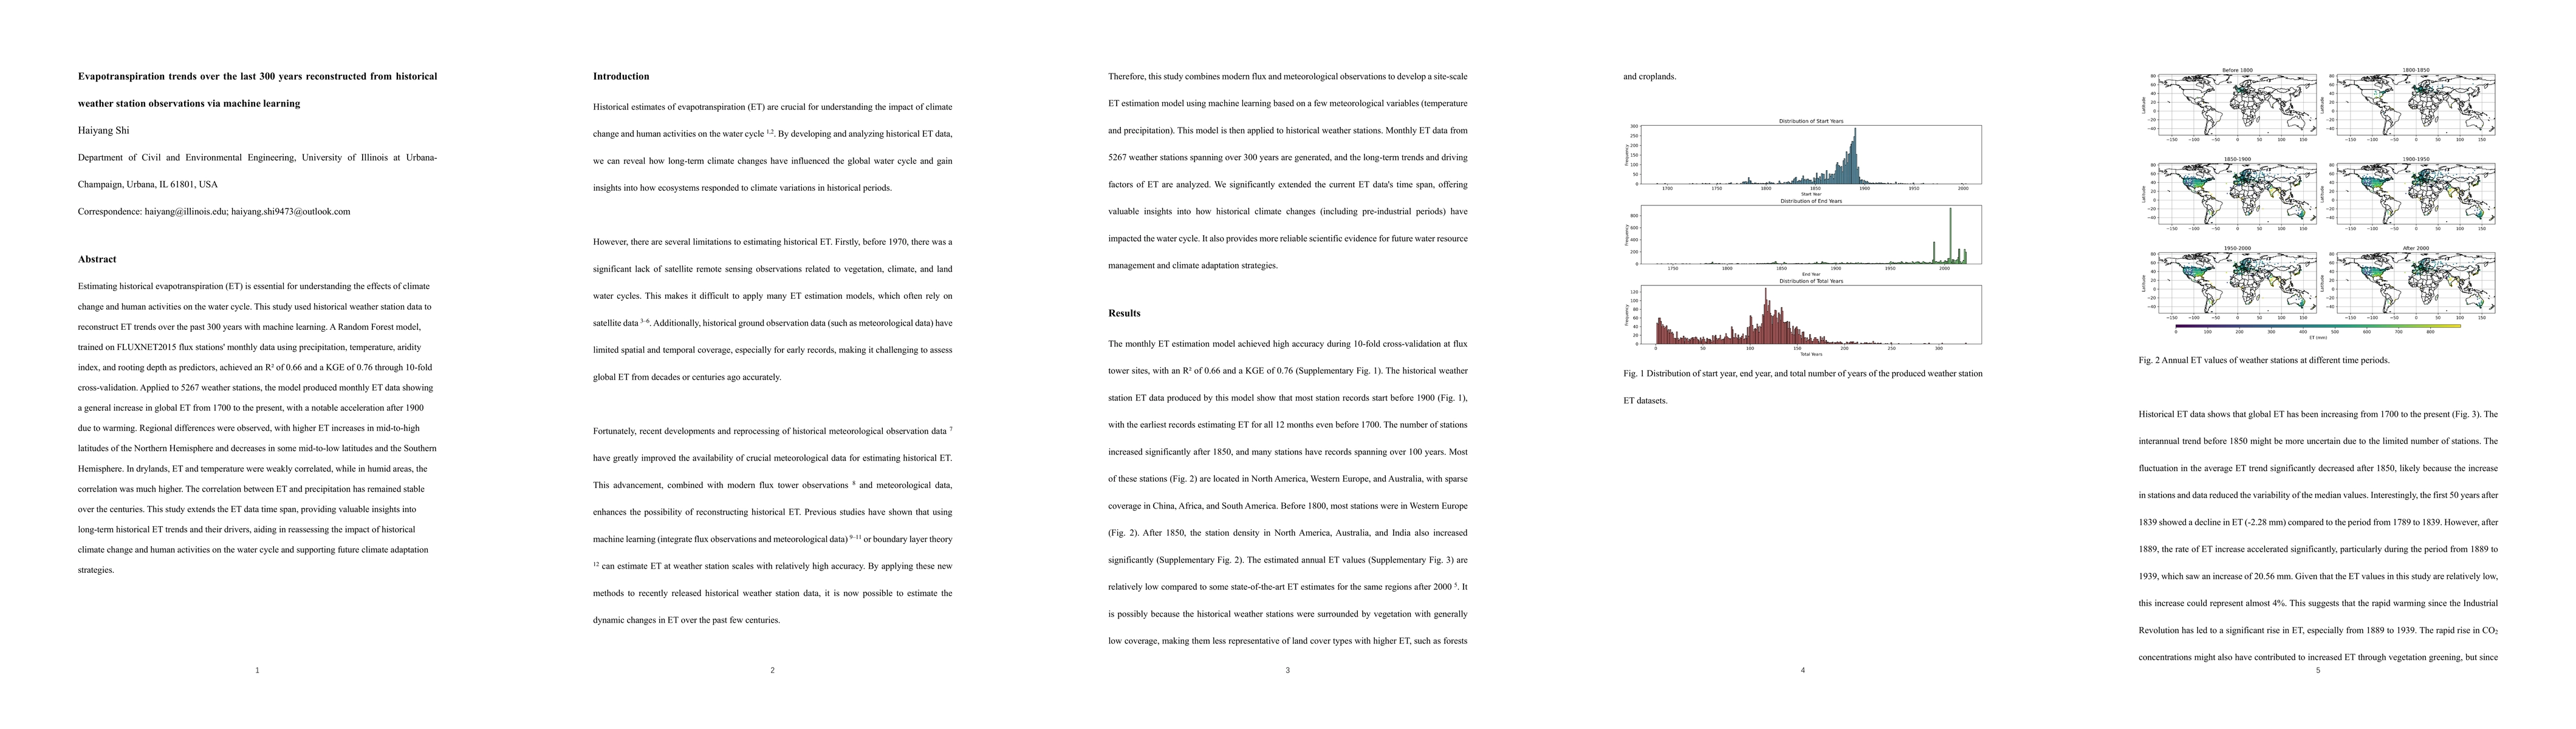
Estimating historical evapotranspiration (ET) is essential for understanding the effects of climate change and human activities on the water cycle. This study used historical weather station data to reconstruct ET trends over the past 300 years with machine learning. A Random Forest model, trained on FLUXNET2015 flux stations' monthly data using precipitation, temperature, aridity index, and rooting depth as predictors, achieved an R2 of 0.66 and a KGE of 0.76 through 10-fold cross-validation. Applied to 5267 weather stations, the model produced monthly ET data showing a general increase in global ET from 1700 to the present, with a notable acceleration after 1900 due to warming. Regional differences were observed, with higher ET increases in mid-to-high latitudes of the Northern Hemisphere and decreases in some mid-to-low latitudes and the Southern Hemisphere. In drylands, ET and temperature were weakly correlated, while in humid areas, the correlation was much higher. The correlation between ET and precipitation has remained stable over the centuries. This study extends the ET data time span, providing valuable insights into long-term historical ET trends and their drivers, aiding in reassessing the impact of historical climate change and human activities on the water cycle and supporting future climate adaptation strategies.
AI Key Findings
Get AI-generated insights about this paper's methodology, results, and significance.
Paper Details
PDF Preview
Citation Network
Current paper (gray), citations (green), references (blue)
Display is limited for performance on very large graphs.
Similar Papers
Found 4 papersPeakWeather: MeteoSwiss Weather Station Measurements for Spatiotemporal Deep Learning
Ivan Marisca, Cesare Alippi, Daniele Zambon et al.
Global pattern and mechanism of terrestrial evapotranspiration change indicated by weather stations
Haiyang Shi
No citations found for this paper.
Comments (0)